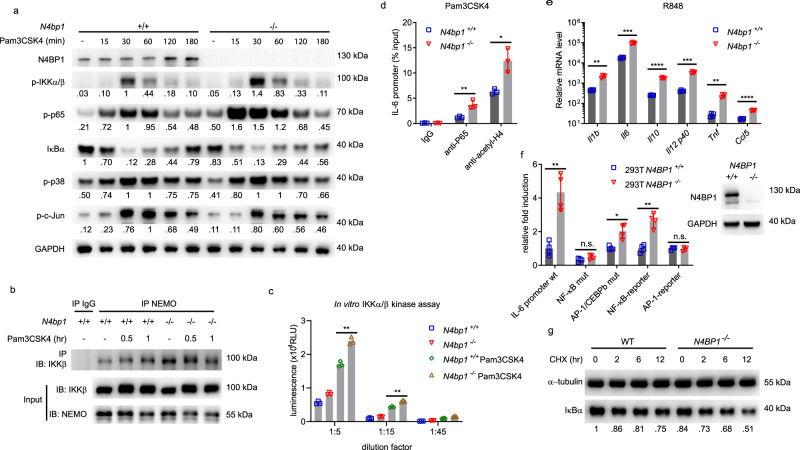
Fig. 2. N4BP1 inhibits NF-κB activation and NF-κB-dependent gene expression.
a Immunoblot analysis of IκBα, or phosphorylated (p-) IKKα/β, p65, p38, and c-Jun in lysates of wild-type and N4bp1−/− peritoneal macrophages stimulated with Pam3CSK4 (40 ng/ml) for the indicated times. Relative densitometric measurements averaged from two independent experiments are indicated below. b Detection of the endogenous NEMO-IKKβ association in wild-type and N4bp1−/− peritoneal macrophages stimulated with Pam3CSK4 for the indicated times, assessed by immunoprecipitation (IP) with rabbit IgG as a control, or with anti-NEMO, followed by immunoblot analysis with anti-IKKβ or anti-NEMO. c In vitro IKKα/β kinase assay. The IKK complex was immunoprecipitated from N4bp1+/+ or N4bp1−/− peritoneal macrophages with anti-NEMO. Cells were treated with or without Pam3CSK4 (40 ng/ml) for 30 min before collection. **P = 0.0011, **P = 0.001, unpaired, two-tailed Student’s t test. d ChIP assay and qPCR of Il6 promoter DNA in peritoneal macrophages 2 h after Pam3CSK4 stimulation. Cell lysates were immunoprecipitated with rabbit IgG, anti-p65, or anti-acetyl-histone H4. **P = 0.007, *P = 0.011, unpaired, two-tailed Student’s t test. e RT-qPCR analysis of Il1β, Il6, Il10, Il12p40, Tnf, and Ccl5 in N4bp1+/+ and N4bp1−/− peritoneal macrophages stimulated with R848. **P = 0.0015, ***P = 0.0002, ****P < 0.0001, ***P = 0.0003, **P = 0.0018, ****P < 0.0001, unpaired, two-tailed Student’s t test. f Left, Luciferase reporter activity dependent on the indicated promoters (X-axis) in wild-type or N4BP1−/− HEK293T cells. Right, immunoblot analysis of N4BP1 expression in wild-type and N4BP1−/− HEK293T cells. **P = 0.0053, *P = 0.0145, **P = 0.0015, unpaired, two-tailed Student’s t test. g Immunoblot analysis of IκBα in lysates of wild-type and N4BP1−/− HEK293T cells treated with cycloheximide (CHX, 20 μg/ml) for the indicated times. Relative densitometric measurements of IκBα averaged from two independent experiments are indicated below. Data points represent macrophage cultures from independent mice (c–e) or independent cultures (f). Data are representative of two independent experiments (a–g). Mean ± s.d. plotted in c–f. P values are listed in order from left to right. Source data are provided in the Source Data file.

