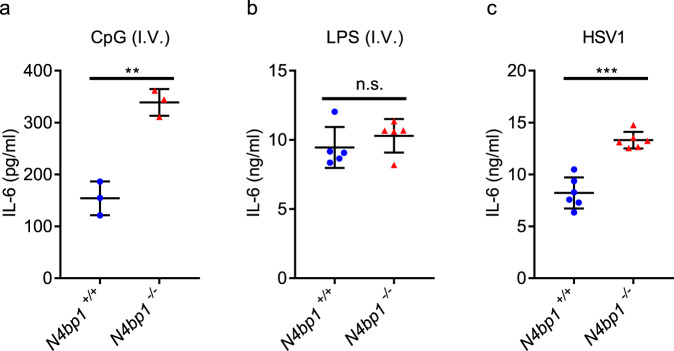
Fig. 6. Enhanced response of N4bp1−/− mice to in vivo CpG and HSV1 stimulations.
a–c Serum concentration of IL-6 in age-matched wild-type and N4bp1−/− mice intravenously (i.v.) injected with a CpG (n = 3 mice per genotype), **P = 0.0019, b LPS (n = 5 mice per genotype), or c HSV1 (n = 6 mice per genotype), ***P = 0.0001. Each symbol a–c represents an individual mouse. Unpaired, two-tailed Student’s t test. Data are representative of two independent experiments (mean ± s.d.). Source data are provided in the Source Data file.

