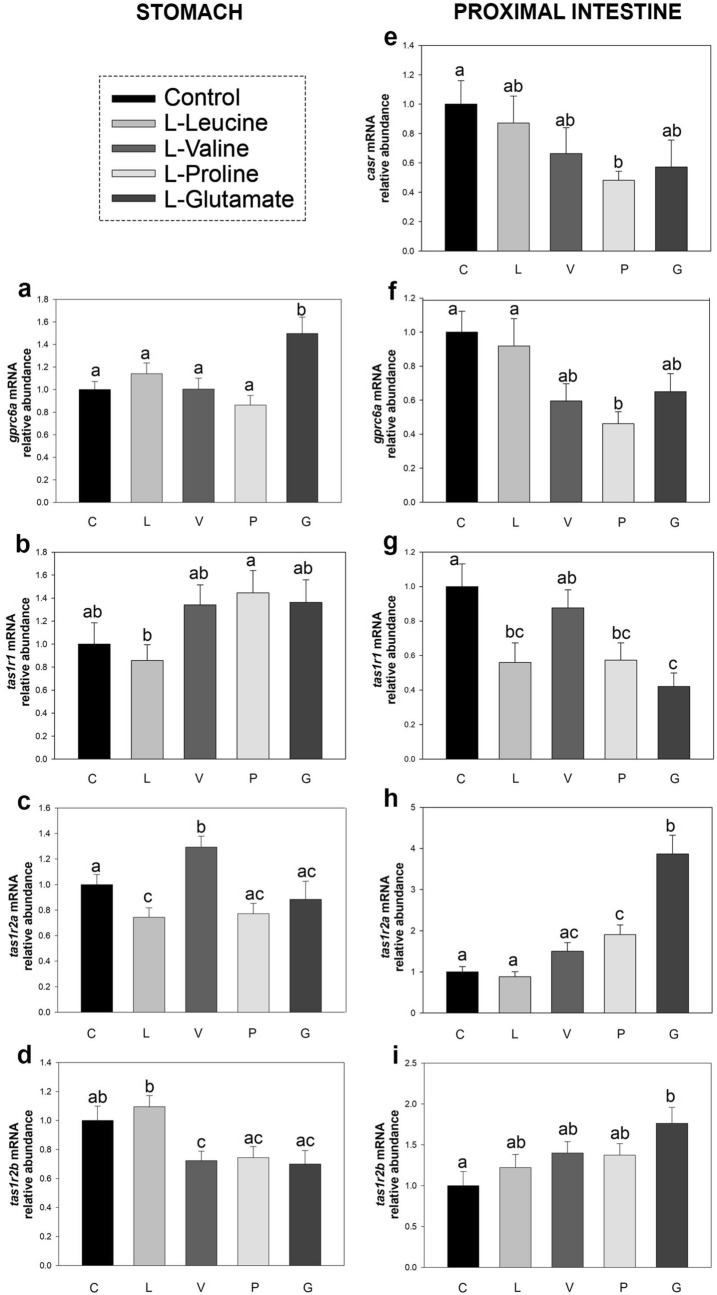
Figure 2.
mRNA abundance of amino acid receptors in stomach (a–d) and proximal intestine (e–i) of rainbow trout 20 min after intragastric administration of 1 mL per 100 g−1 bw saline alone (control, C) or containing 40 μmol per mL−1 of l-leucine (L), l-valine (V), l-proline (P) or l-glutamate (G). Data obtained by RT-qPCR were normalized to the expression of actb and ee1af1α and are expressed as mean + SEM (n = 6), relative to the control group. Statistical differences among groups were assessed by one-way ANOVA and post-hoc Student–Newman–Keuls test using SigmaPlot software version 12.0. Significant differences are denoted by the use of letters: bars sharing the same letter are not statistically significant, while if two bars have different letters they are significantly different (p < 0.05). casr, calcium-sensing receptor; gprc6a, G protein-coupled receptor family C group 6 member A; tas1r1, tas1r2a, tas1r2b, taste receptor 1 family member 1, 2a, and 2b.

