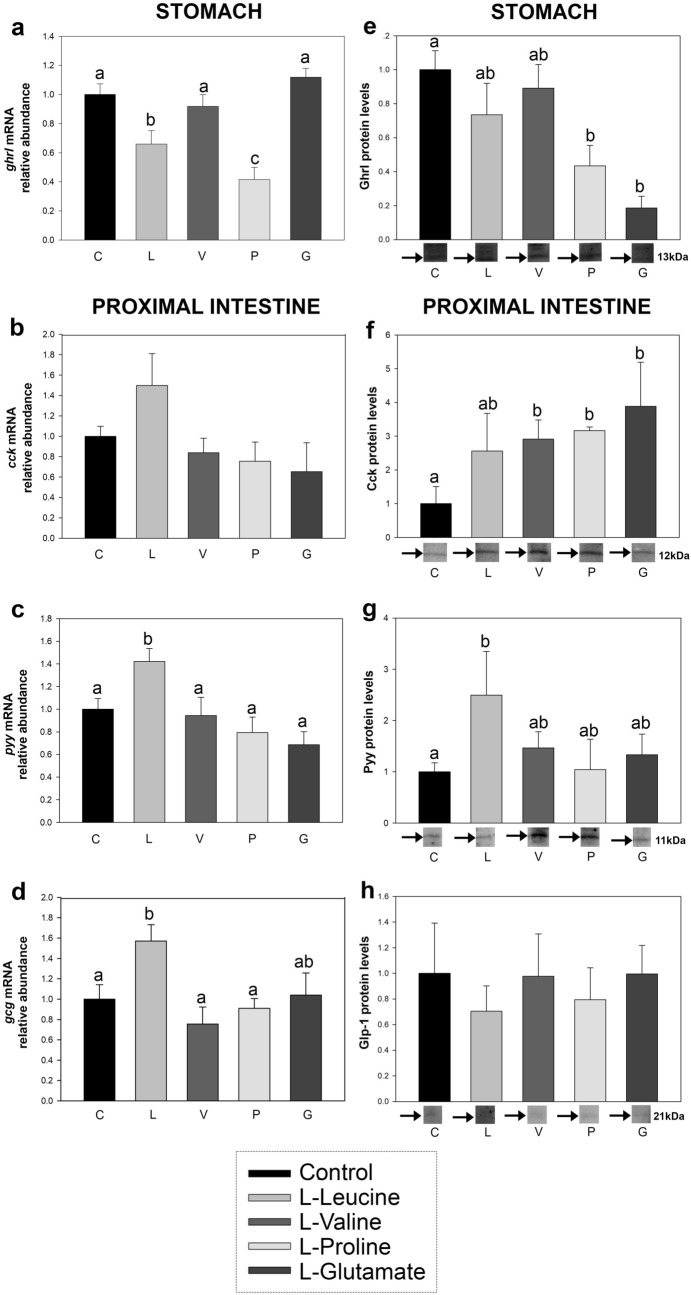
Figure 5.
mRNA abundance of gut hormones (a–d) and proteins (e–h) in stomach (Grl) or proximal intestine (Cck, Pyy and Glp-1) of rainbow trout 20 min after intragastric administration of 1 mL per 100 g−1 bw saline alone (control, C) or containing 40 μmol per mL−1 of l-leucine (L), l-valine (V), l-proline (P) or l-glutamate (G). Data obtained by RT-qPCR (a–d) and Western blot (e–h) are expressed as mean + SEM (n = 6), relative to the control group. For (a–h), a representative band of each experimental group is shown for each protein; please refer to Supplementary Fig. S2 for entire blots. Protein bands were quantified by densitometry using Image Lab software, relative to the amount of total protein. Statistical differences among groups were assessed by one-way ANOVA and post-hoc Student–Newman–Keuls test using SigmaPlot software version 12.0. Significant differences are denoted by the use of letters: bars sharing the same letter are not statistically significant, while if two bars have different letters they are significantly different (p < 0.05).p Cck, cholecystokinin; gcg, proglucagon; Ghrl, ghrelin; Glp-1, glucagon-like peptide-1; Pyy, peptide tyrosine-tyrosine.

