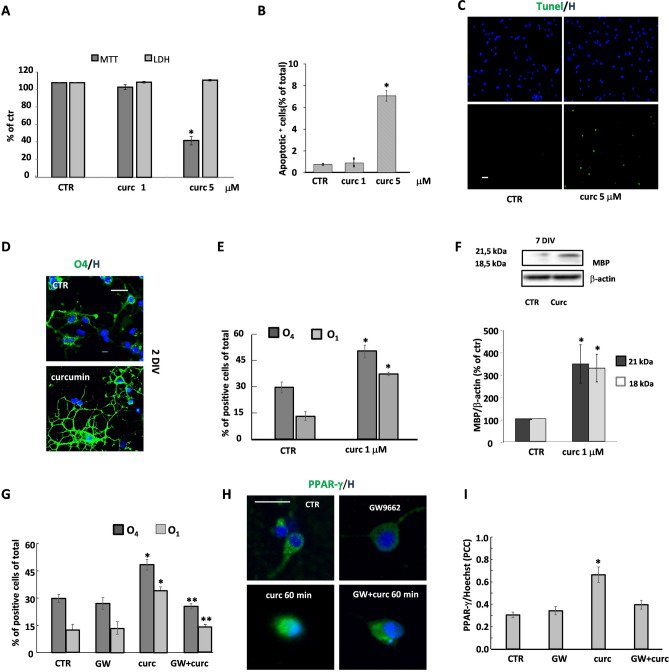
Figure 1.
Effects of curcumin on OP viability and differentiation. The effects of 24 h treatment with curcumin (curc, 1 or 5 μM) on OP viability were examined using the MTT assay and the LDH level production. The values (means ± SEM) from 3 to 5 independent experiments run in triplicate are shown in (A). The number of apoptotic cells was evaluated in OP cultures exposed to 1 or 5 μM curcumin. Total cell numbers were assessed by staining with Hoechst 33258 vital dye and apoptotic cells were identified by nuclear morphology (B) or by Tunel assay (green labelling, C). Data of both tests are included, and the percentages of total cell number in each condition are showed. Labelled cells were counted in 6 to 10 coverslips from 3 to 5 independent experiments (B). *p < 0.0001 vs CTR. After 24 h of curcumin treatment (1 μM), OPs were immunostained for the two developmental markers O4 and O1. Nuclei were marked using the Hoechst 33258 (H). Panel (D) shows O4 (green) and H (blue) labelling. Cells were counted and percentages of O4- and O1-positive cells are shown in (E). Data are mean ± SEM of 10 microscopic fields per coverslip prepared in duplicate from 3 to 5 independent experiments. At 7 DIV (F) the expression of MBP was evaluated by western blot analysis. Representative western blot of two isoforms (18 e 21 kDa) of MBP and β-actin are shown (top panel in F). Bar graphs show the quantitative evaluation of MBP/β-actin expression ratio of both isoforms from three different experiments (bottom panel in F). To verify the involvement of PPAR-γ, OPs at 1 DIV were treated for 24 h with curc (1 μM) in the presence or absence of the PPAR-γ antagonist GW9662 (GW) (1 μM) and the percentages of O4 and O1 positive cells were evaluated (G). Data are mean ± SEM of 3 to 5 independent experiments *p < 0.001 versus CTR, **p < 0.001 versus curc. The translocation of PPAR-γ in the presence/absence of curcumin and GW9662 was evaluated by immunofluorescence. Panel (H) shows PPAR-γ (green) and H (blue) labelling. The colocalization of PPAR-γ and Hoechst fluorescence signal was evaluated by Pearson’s correlation coefficients (PCC) where PCC = 1 corresponds to maximal colocalization. Data are mean ± SEM of 3 independent experiments. Scale bar = 30 µm. Image Lab 4.0 software (Bio-Rad, http://www.bio-rad.com/en-us/sku/1709690-image-lab-software) and Leica Application Suite Software (260RI, https: //www.leica-microsystems.com/products/microscope-software/details/product/leica-las-x-ls/) were used respectively for Wb and IF image acquisitions.

