Figure 5.
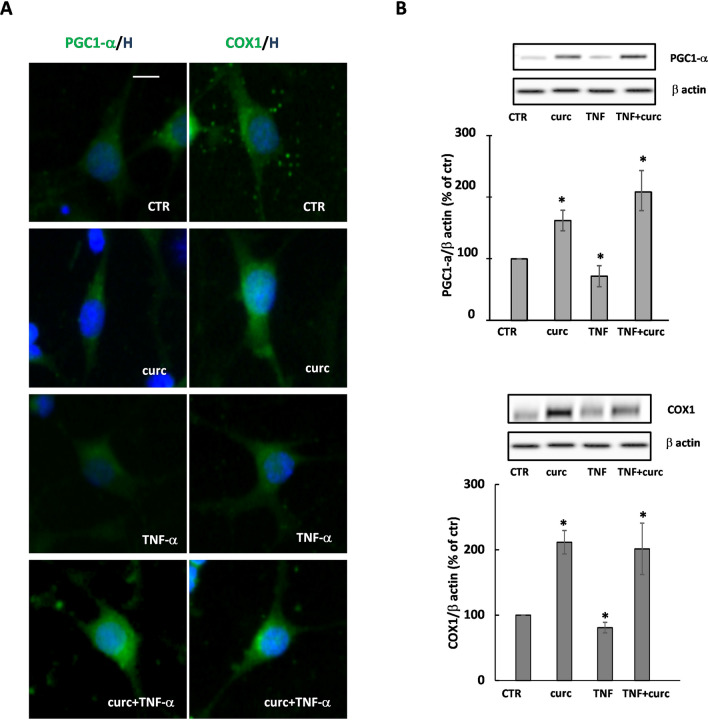
Curcumin protects from the effect of TNF-α on PGC1-α and COX1 expression. PGC1-α and COX1 expression levels were evaluated in cells treated for 24 h with curcumin (curc) and/or TNF-α. Representative photomicrographs are shown (A). Nuclei were stained using the Hoechst 33258 nuclear fluorochrome (blue, H). Representative western blot of PCG1-α or COX1 and β-actin (used as an internal control) are shown (B). The intensities of bands corresponding to PCG1-α or COX1 and β-actin were measured by densitometric analysis and the ratio PCG1-α/β-actin or COX1/β-actin is given as percentage on untreated cells. Data are means ± SEM of three independent experiments *p < 0.05 versus CTR, **p < 0.005 versus curc + TNF-α. Scale bar 10 µm. Image Lab 4.0 software (Bio-Rad, http://www.bio-rad.com/en-us/sku/1709690-image-lab-software) and Leica Application Suite Software (260RI, https: //www.leica-microsystems.com/products/microscope-software/details/product/leica-las-x-ls/) were used respectively for Wb and IF image acquisitions.

