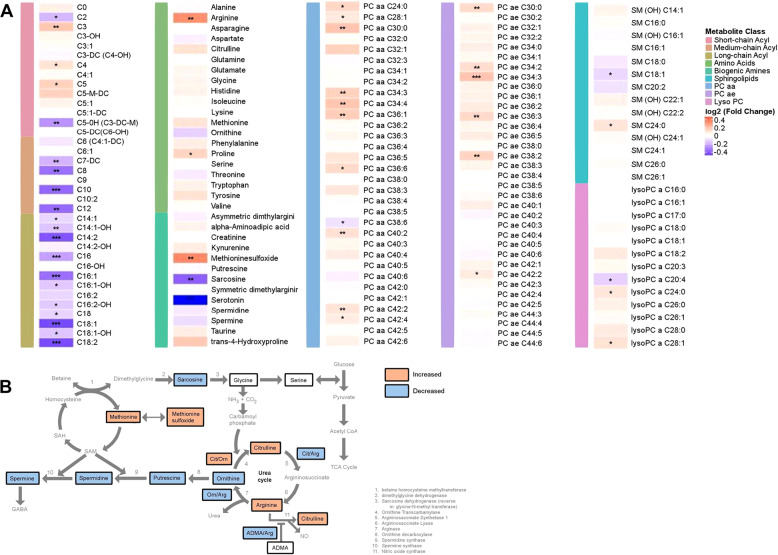
Fig. 2. Change in metabolite levels from pre-treatment to 8 weeks post-treatment with escitalopram/citalopram.
A Heatmap depicting log2-fold changes in metabolite levels. P values were obtained using linear mixed-effect models controlling for age, sex, and baseline HRSD17 were corrected for multiple comparisons. Red indicates an increase and blue indicates a decrease in metabolite levels over 8 weeks of treatment; *q-value < 0.05, **q-value < 0.01, and ***q-value < 0.001. PC phosphatidylcholine, SM sphingomyelin, LysoPC lysophosphatidylcholine, SSRI selective serotonin reuptake inhibitor, HRSD17 17-item Hamilton Rating Scale for Depression. Metabolite abbreviations are spelled out in Supplementary Table 1. B Effect of SSRI on interconnected pathways, including polyamine, sarcosine, urea cycle, and 1-carbon metabolism. Orange boxes indicate an increase in metabolite levels, while blue boxes represent a decrease in metabolite levels. White boxes represent no change in in metabolite levels. Metabolites not measured in this assay are in gray. NH3 ammonia, CO2 carbon dioxide, SAH S-adenosyl-l-homocysteine, SAM S-adenosyl methionine, Cit citrulline, Orn ornithine, Arg arginine, ADMA asymmetric dimethylarginine, CoA coenzyme A.

