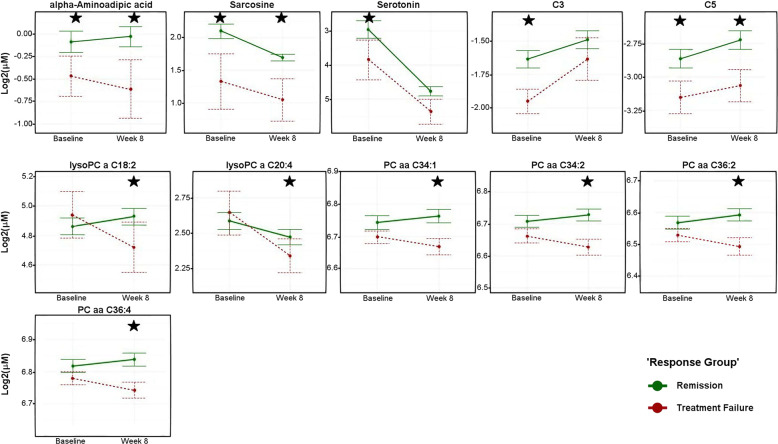
Fig. 4. Metabolite concentrations across visits by response group.
Levels (log2 transformed) of metabolites at pre-treatment and 8 weeks post-treatment. Green lines indicate participants who remitted and red lines indicate participants who failed to respond to the treatment at the end of therapy. Asterisks indicate the statistical significance of mean differences between the two groups (unadjusted P < 0.05). Error bars represent the standard error of the means. Black stars represent statistical significance at the visit. P values were obtained from linear mixed-effect models corrected for age, sex, antidepressant, and 17-item Hamilton Rating Scale for Depression scores. PC phosphatidylcholines, LysoPC lysophosphatidylcholine. Metabolite abbreviations are spelled out in Supplementary Table 1.

