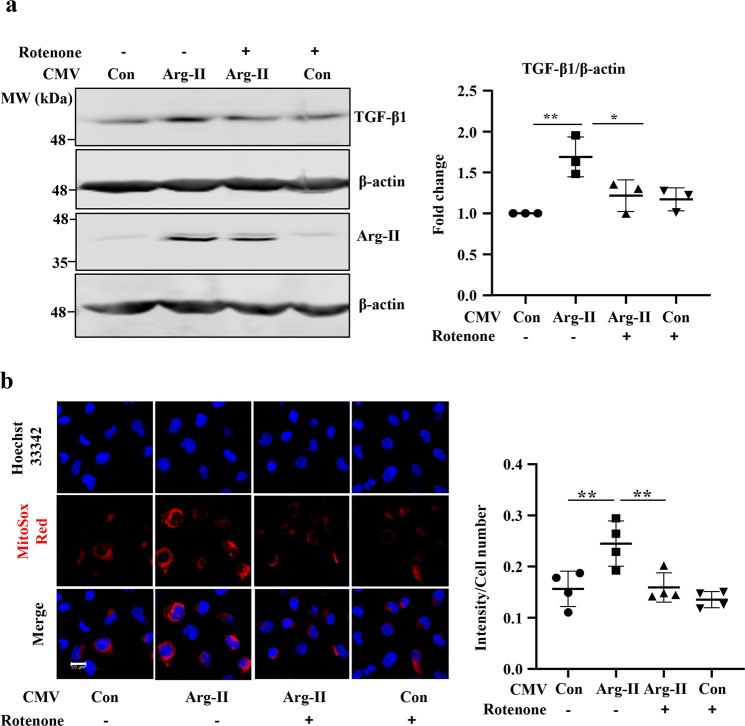
Fig. 9. Arg-II induces TGF-β1 expression via mitochondrial oxidative stress in HK-2 cells.
HK-2 cells were pre-treated with rotenone (2 μmol/L) for 1 h and then were transduced with rAd/CMV empty vector as control (V5) or rAd/CMV-Arg-II (Arg-II) for 24 h. a Immunoblotting analysis for TGF-β1, Arg-II, and β-actin. The graph on the right shows the quantification of the signals on immunoblots. n = 3. b Cells were subjected to mitochondrial superoxide detection with MitoSox (red), followed by nuclei staining with Hoechst 33342 (blue). The images were taken from MitoSox staining through ×40 objectives with Leica TCS SP5 confocal microscope. n = 4. Scale bar = 20 μm. The plot graphs on the right show the quantification of the signals. Con control. Data are presented as mean ± SEM. *p ≤ 0.05, **p ≤ 0.01.

