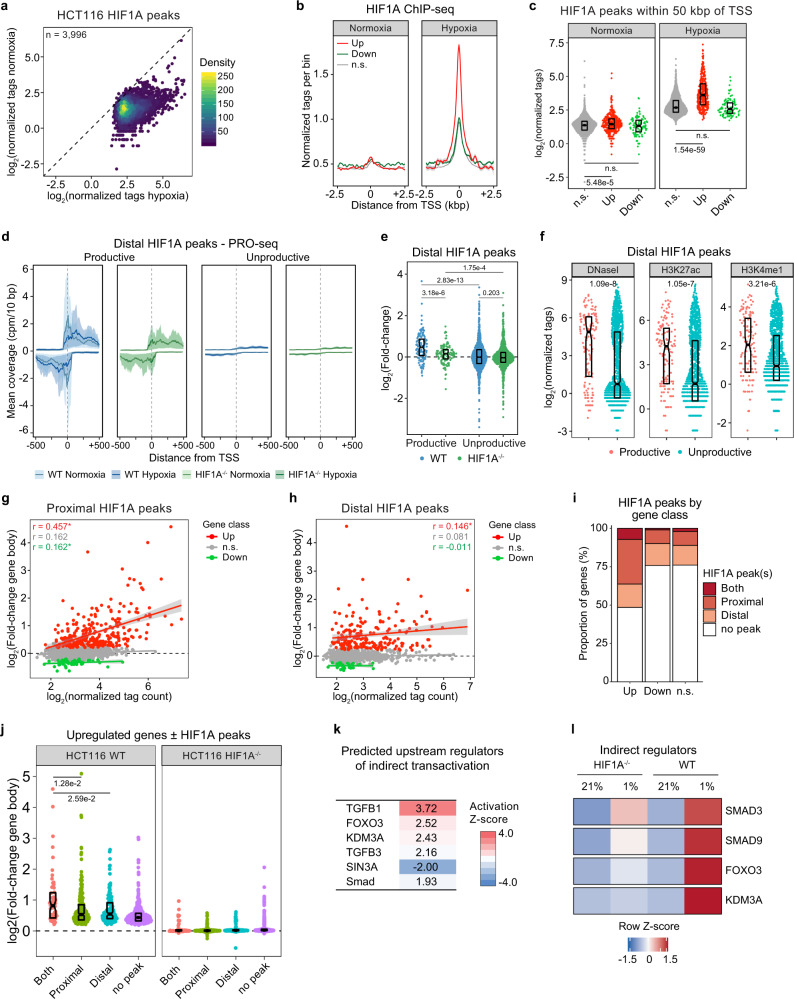
Fig. 2. Acute transactivation, not repression, is associated with HIF1A binding.
a Comparison of enrichment signal in normoxia and hypoxia for HIF1A peaks called in hypoxic HCT116 wild-type (WT) cells (n = 3996 peaks). Points are colored by density. b Meta profile showing typical HIF1A occupancy profile over transcription start sites (TSS) of upregulated (red), downregulated (green), and not significantly regulated (n.s., gray) genes during acute hypoxia. Data are represented as splined linear fit lines with 95% confidence intervals in gray. c Enrichment signal for HIF1A peaks within 50 kbp of TSS, separated by gene body differential expression class: not significantly regulated (n.s., gray), upregulated (red), downregulated (green). Horizontal spread of data points is proportional to density; boxes indicate medians and upper and lower quartiles; horizontal bars with numbers indicate FDR-adjusted p-values for two-sided Mann–Whitney U tests. d Meta profiles showing typical PRO-seq signal profile across distal HIF1A peak regions associated with genes upregulated (Productive) or not upregulated (Unproductive) during acute hypoxia in HCT116 WT (blue) and HIF1A−/− (green) cells. Data are represented as splined linear fit lines with 95% confidence intervals in lighter shades, with positive and negative values reflecting signal density on + and − genomic DNA strands, respectively. e Distributions of fold changes in PRO-seq signal (+/− strands combined) within ±250 bp of distal HIF1A peaks, separated by association with genes upregulated (Productive) or not upregulated (Unproductive) during acute hypoxia in HCT116 WT (blue) and HIF1A−/− (green) cells. Horizontal spread of data points is proportional to density; boxes indicate medians and upper and lower quartiles; numbers indicate FDR-adjusted p-values for two-sided Mann–Whitney U tests. f Distributions of DNaseI accessibility or ChIP-seq signal enrichment for various chromatin marks within regions corresponding to distal HIF1A peaks associated with genes upregulated (Productive, pink) or not upregulated (Unproductive, teal) during acute hypoxia. Horizontal spread of data points is proportional to density; boxes indicate medians and upper and lower quartiles; numbers indicate p-values for two-sided Mann–Whitney U tests. g, h Comparison of PRO-seq (gene body) fold-change with ChIP-seq peak signal for proximal (g) and distal (h) HIF1A peaks. Gene class indicates PRO-seq gene body differential expression: not significantly regulated (n.s., gray), upregulated (red), downregulated (green). Solid lines in corresponding colors denote linear model fits to the data, with 95% confidence intervals in gray. Numbers in upper left are Pearson correlation coefficients in corresponding colors; * denotes significant correlations (p-value < 0.05). i Proportions of genes in each class associated with proximal and/or distal HIF1A peaks. j Distributions of fold changes in gene body activity for upregulated genes associated with different classes of HIF1A peaks: proximal and distal (Both, pink), proximal only (green), distal only (teal), or no peak (purple). Horizontal spread of data points is proportional to density; boxes indicate medians and upper and lower quartiles; numbers indicate FDR-adjusted p-values for two-sided Mann–Whitney U tests. k Heatmap of activation Z-scores for upstream regulator predictions by the Ingenuity Pathway Analysis suite for acutely upregulated genes lacking associated HIF1A binding. l Heatmap showing relative expression of putative indirect regulators of the acute hypoxic response. Data are represented as row-wise Z-scores calculated from RPKM values. See also Supplementary Fig. 3 and Supplementary Data 3.

