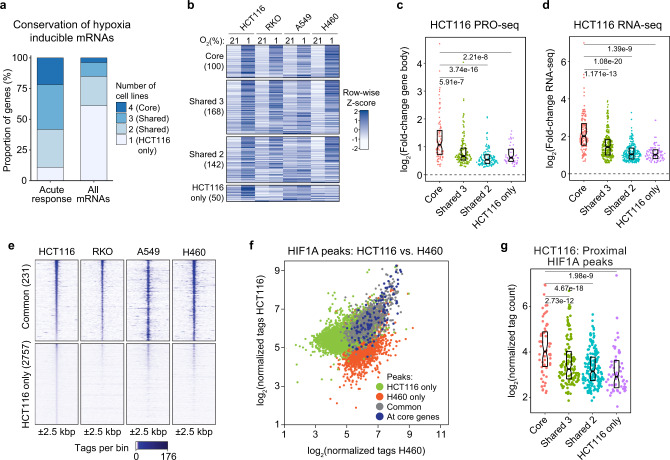
Fig. 5. Upregulation of acute response genes by HIF1A is conserved in multiple cell types.
a Proportions of genes upregulated at both mRNA and PRO-seq levels (Acute response) or at the mRNA level (All mRNAs) in HCT116 cells with mRNA upregulation in one or more cell types. b Heatmap showing relative mRNA levels for acute response genes, grouped by conservation as in (a), across all four cell types during normoxia (21% O2) or hypoxia (1% O2). Data are represented as Z-scores calculated from RNA-seq RPKM values. c, d Fold-change distributions for gene body transcription activity (c, PRO-seq) and mRNA levels (d, RNA-seq) in HCT116 cells, separated by conservation group as in (a): core (pink), shared 3 (green), shared 2 (blue), and HCT116 only (purple). Horizontal spread of data points is proportional to density; boxes indicate medians and upper and lower quartiles; horizontal bars with numbers indicate FDR-adjusted p-values for two-sided Mann–Whitney U tests. e Heatmap of enrichment signal (±2.5 kbp, 100 bp bins) in HCT116, RKO, A549, and H460 cells exposed to hypoxia (1% O2 for 24 h) for HIF1A peaks called in all four cell lines (Common) and peaks called only in HCT116 cells. Rows are sorted by HCT116 enrichment signal. f Comparison of enrichment signal in hypoxic HCT116 vs. H460 cells for HIF1A peaks called in one or both cell types. Colors highlight common (gray) and cell type-specific peaks (green, red) as well as peaks associated with genes with conserved upregulation in all four cell lines (core genes, blue). g Distributions of enrichment signal in hypoxic HCT116 cells for proximal HIF1A peaks associated with acute response genes, separated by conservation group as in (a): core (pink), shared 3 (green), shared 2 (blue), and HCT116 only (purple). Horizontal spread of data points is proportional to density; boxes indicate medians and upper and lower quartiles; horizontal bars with numbers indicate FDR-adjusted p-values for two-sided Mann–Whitney U tests. See also Supplementary Fig. 7.

