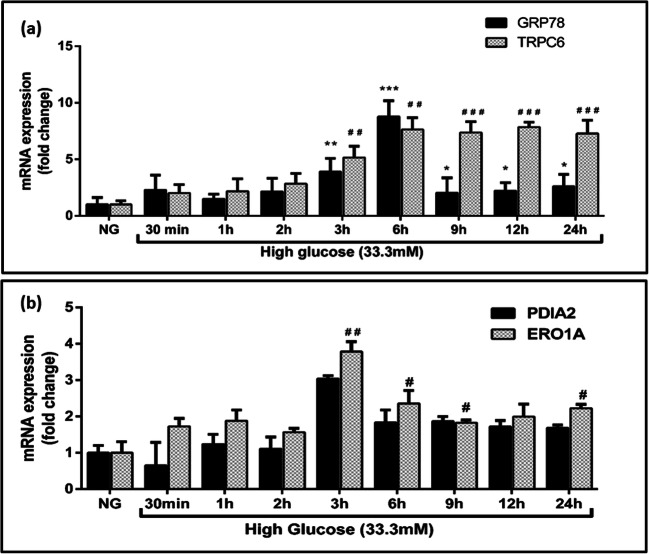
Fig. 4.
a Effect of ER and oxidative stress markers in high glucose (33.3 mM) treated in THP-1 cells under different time points. b Effect of crosstalk markers in high glucose stimulated THP-1 cells under different time intervals and assessed the gene expression using qRT-PCR. Data are expressed as fold change over control and presented as mean ± SD of three separate experiments. Statistical analysis was performed using unpaired “t” test with the Welch corrections. *p < 0.05, **p < 0.01, and ***p < 0.001

