Fig. 4.
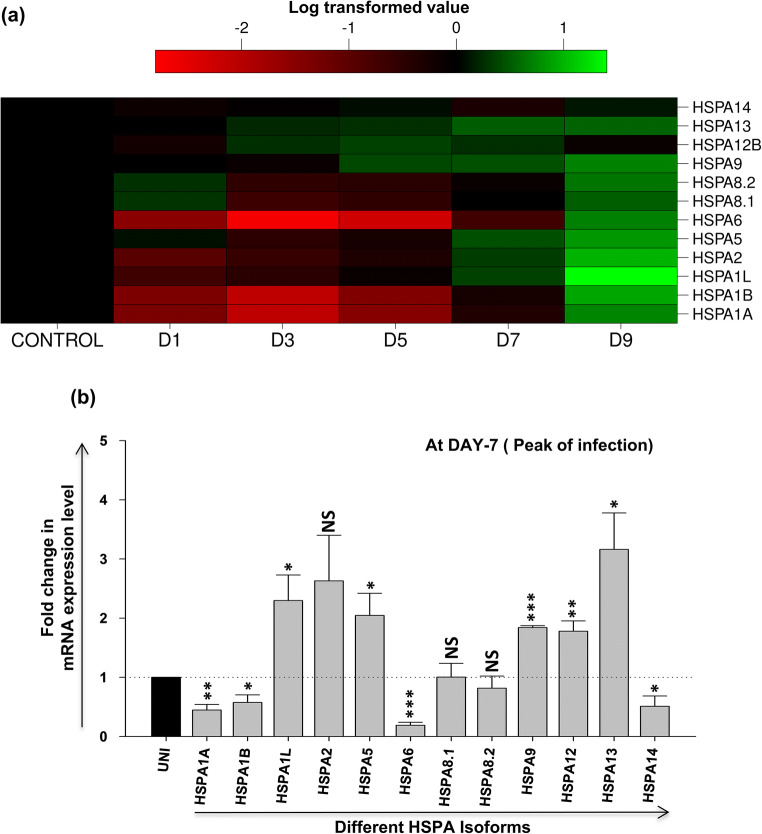
Expression profile of different HSP70 isoforms during HIV-1 infection. CEM-GFP cells were infected with 0.1 MOI of HIV-1NL4.3 virus and harvested at different days post-infection (days 1, 3, 5, 7, and 9) and was followed by qRT-PCR to determine mRNA expression level of different HSP70 isoforms. (a) expression kinetics of different HSP70 isoforms at different days post-infection presented as heat map using logarithmic-transformed fold change mean values (n = 3). The abscissa represents the number of days post-infection in the experiment and the ordinate represents different isoforms of HSP70. (b) Fold change in mRNA expression level of different HSP70 isoforms at peak of HIV-1 infection (day 7 post-infection). The results represent mean ± S.E. from n = 3 independent experiments and statistical significance is determined by using Student’s t test, *p < 0.05, **p ≤ 0.01, and ***p ≤ 0.001

