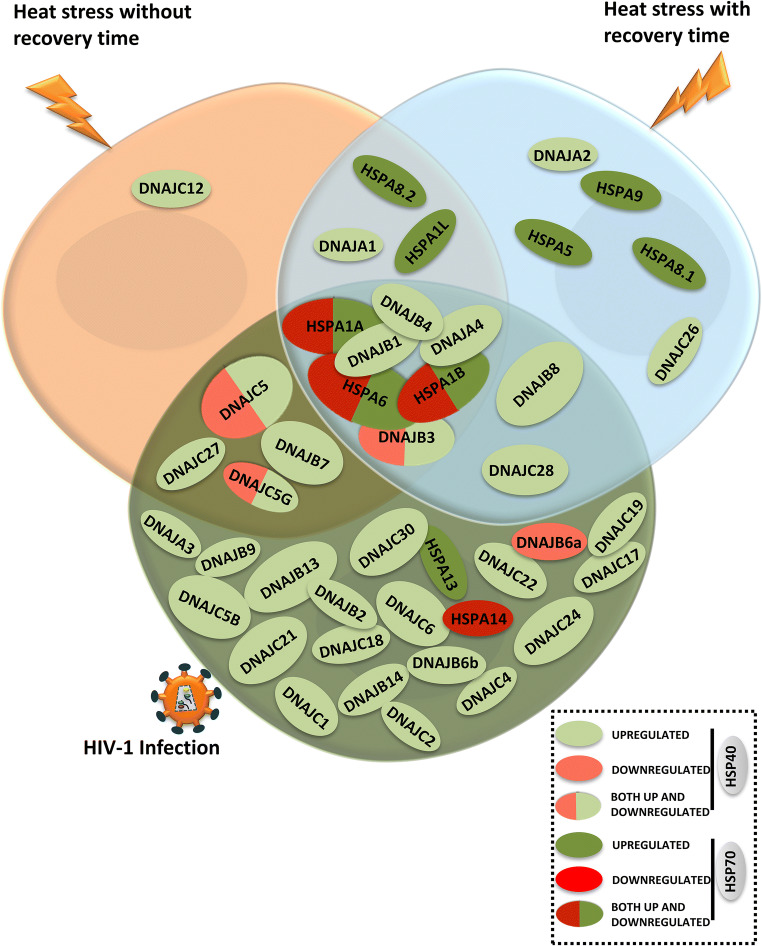
Fig. 6.
Graphical representation for differential modulation of HSP40 and HSP70 isoforms during heat stress (with and without recovery period) and HIV-1 infection in CEM-GFP cells at peak of infection (day 7) highlighting modulated common and unique isoforms. In case of HSP40 isoforms, oval shape with light green denotes upregulation, light red denotes downregulation, while oval with both color denotes opposite modulation in both the stress conditions. In case of HSP70 isoforms, oval shape with dark green denotes upregulation, dark red denotes downregulation, while oval with both color denotes opposite modulation in the two stress conditions)

