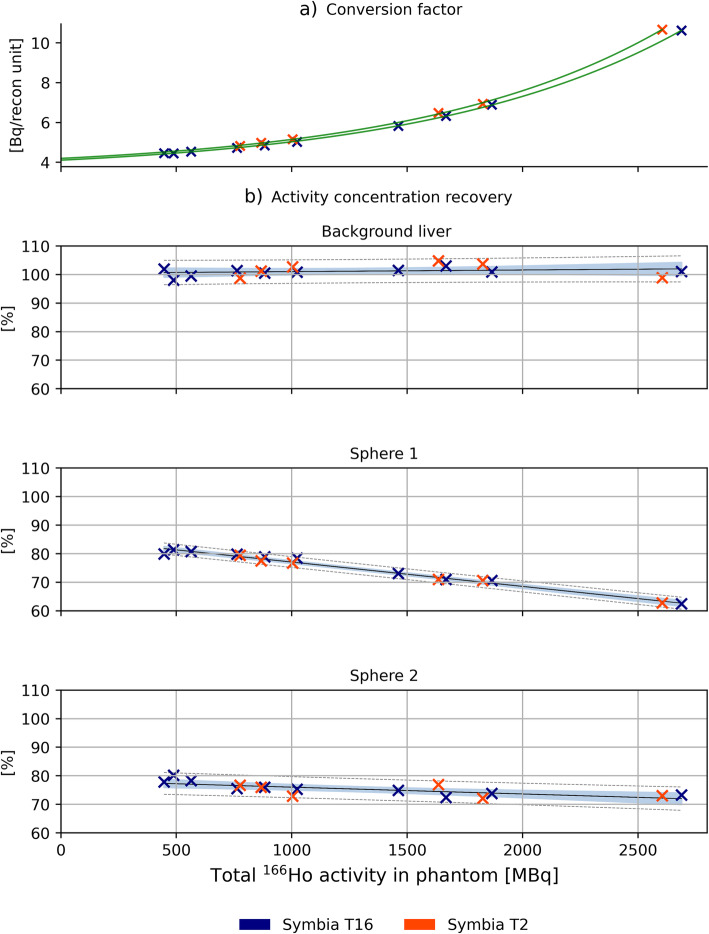
Fig. 4.
a Individual conversion factor between Bq and reconstruction values was computed for each measurement based on the total activity in the phantom at the scanning time. Its trend, as function of activity, is reported together with the individual measurements. b Activity concentration recovery as function of total activity in phantom at scanning time. A complete activity concentration recovery is obtained for non-tumorous liver (b)—top panel) while partial recovery for the spheres (b)—middle and bottom panel). Linear regression is represented by the black line, while gray dashed lines represent prediction intervals. Data in the blue area are within the confidence intervals

