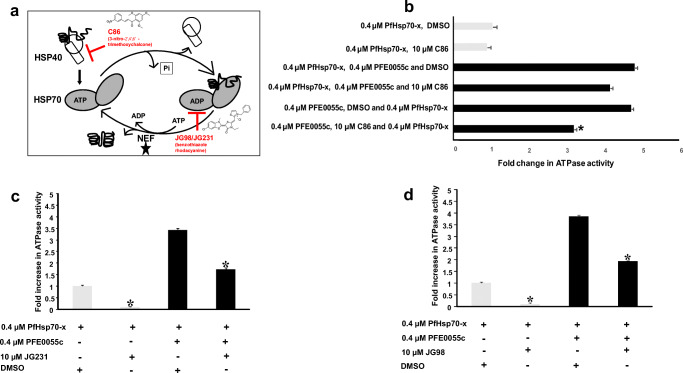
Fig. 3.
Effect of inhibitors on basal and PFE0055c-stimulated PfHsp70-x ATPase activity. (a) Schematic diagram of the nucleotide-dependent Hsp70 substrate binding and release cycle, showing that the allosteric inhibitors JG98 and JG231 lock Hsp70 in the ADP bound form, thereby inhibiting nucleotide exchange (promoted by nucleotide exchange factors, NEFs) and the JDP pan-inhibitor C86 which specifically binds to the J domain. (b) C86 inhibited only PFE0055c-stimulated PfHsp70-x ATPase activity. The grey bars represent basal ATPase activity for PfHsp70-x (set as 1.0 for PfHsp70-x DMSO) in comparison to black bars representing fold increase in PFE0055c-stimulated activity. The Y-axis legend indicated the order in which reaction constituents were added. (c) JG231 and (d) JG98 inhibited basal and PFE0055c-stimulated PfHsp70-x ATPase activity. The bar graphs show the basal (set a 1.0 for PfHsp70-x DMSO) and fold increase in PFE0055c-stimulated ATPase activities of PfHsp70-x expressed as mean ± SEM. Error bars are indicated on each bar and the asterisk (*) indicates statistical significance at P < 0.05 relative to the basal ATPase value using the Student t test. Shown here are the combined data from at least three independent experiments performed in triplicate using independently purified proteins for each experiment

