Fig. 4.
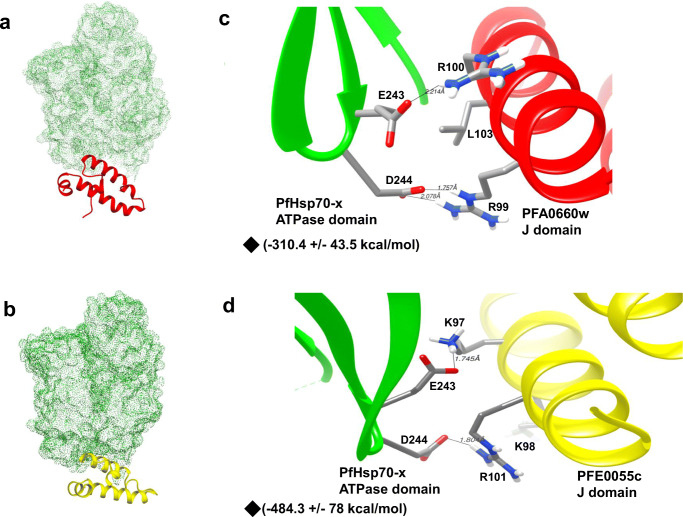
Depth-cued 3D models of PFA0660w and PFE0055c showing proximity to the interactive surface of PfHsp70-x. (a) 3D representation of the best molecular docking pose between the J domain of PFA0660w and the ATPase domain of PfHsp70-x. PFA0660w is highlighted as red cartoons and PfHsp70-x as a green dotted surface. (b) 3D representation of the best molecular docking pose between the J domain of PFE0055c and the ATPase domain of PfHsp70-x. PFE0055c is highlighted as a yellow cartoon and PfHsp70-x as a green dotted surface. (c) Docked pose of the J domain of PFA0660w (red) with the ATPase domain of PfHsp70-x (green) in ribbon form with critical interacting residues (R99, R100, L103 in PFA0660w and E243, D244 in PfHsp70-x) focused and shown as sticks. (d) Docked pose of the J domain of PFE0055c (yellow) with the ATPase domain of PfHsp70-x (green) with critical interacting residues (K97, K98, R101 in PFE0055c and E243, D244 in PfHsp70-x) focused and shown as sticks. Hydrogen bonds have been represented as dotted lines and are labelled with respective distances. The red, blue, white, and grey colours represent oxygen, nitrogen, hydrogen, and carbon, respectively. ◆- Electrostatic binding energy. The molecular docking was conducted using HADDOCK2.2, and the graphical images were rendered using UCSF Chimera 1.10.1

