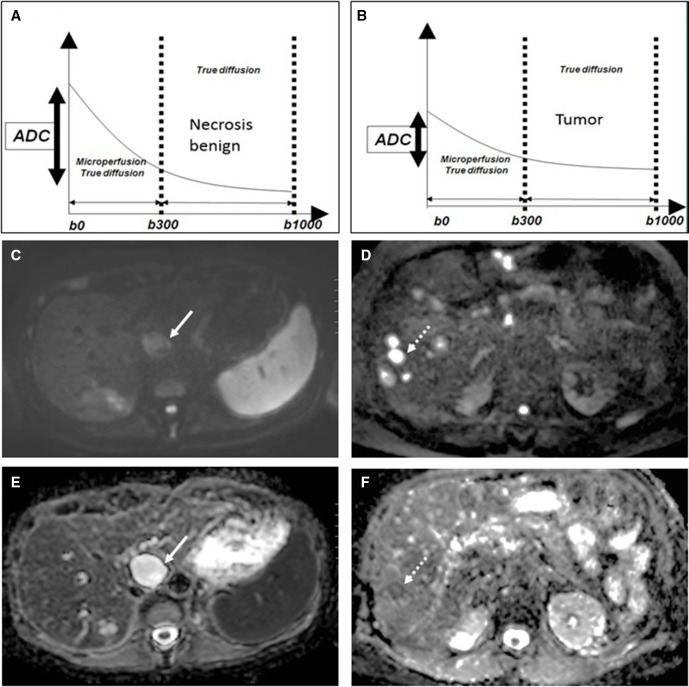
Figure 1.
Diffusion-weighted imaging-based characterization of (A, C, E) benign biliary cyst (arrow) versus (B, D, F) malignant liver metastases (dashed arrow). (A) the signal decay curve of the biliary cyst shows strong decrease in signal intensity over the consecutive b-value sequences resulting in high calculated apparent diffusion coefficient. (C) on the b1000 image. The biliary cyst appears with low signal intensity and (E) white on the apparent diffusion coefficient map. (B) the signal decay curve of the liver metastasis shows only a limited decrease in signal intensity over the consecutive b-value sequences, resulting in a low calculated apparent diffusion coefficient. (D) on the b1000 image, the liver metastasis appears bright and (F) dark on the apparent diffusion coefficient map.

