Figure 4.

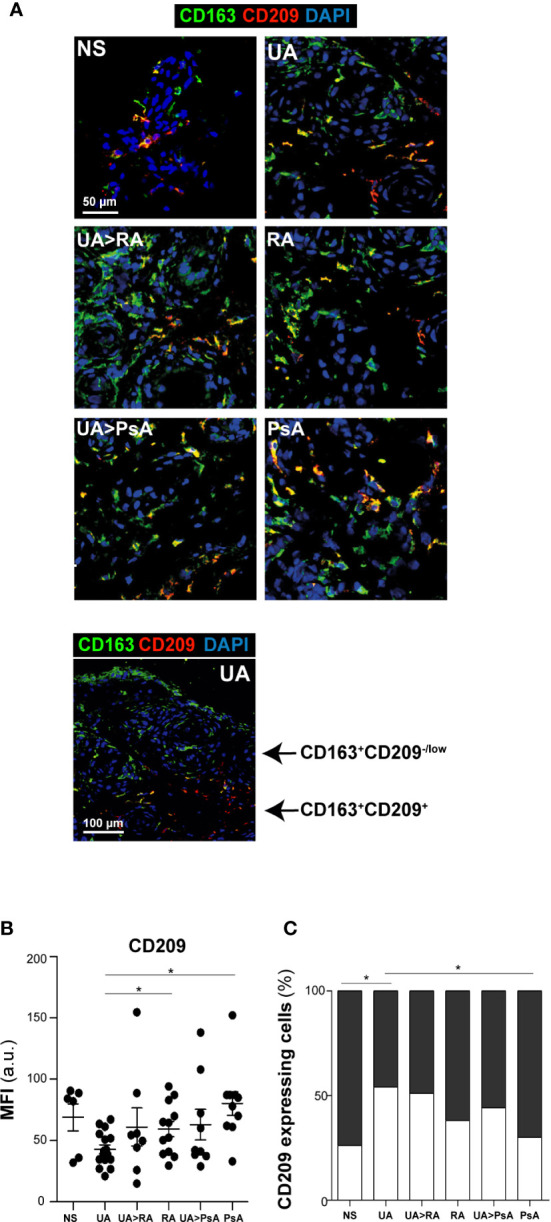
CD163+ CD209 macrophage subsets in synovial tissue. (A) CD163 (green) and CD209 (red) staining of NS, UA, UA-RA, RA, UA-PsA, and PsA synovial tissues. Scale bar, as shown. (B) Summary dot plot showing mean MFI values of CD209 expression in CD163+ macrophages from synovial tissue samples. The experiment was carried out in independent samples from each type (NS, n=6; UA, n=16; UA>RA, n=8; RA, n=12; UA>PsA, n=9; and PsA, n=10) and representative experiments are shown. Mean ± SEM are shown (* p < 0.05, Mann-Whitney test). (C) Percentage of CD209-expressing macrophages in NS, UA, UA>RA, RA, UA>PsA, and PsA synovial tissues. The MFI values of eight to 12 tissues samples of each group were used for classification as “low/neg” (white) or “high” (> 34 a.u., black) CD209 expression.
