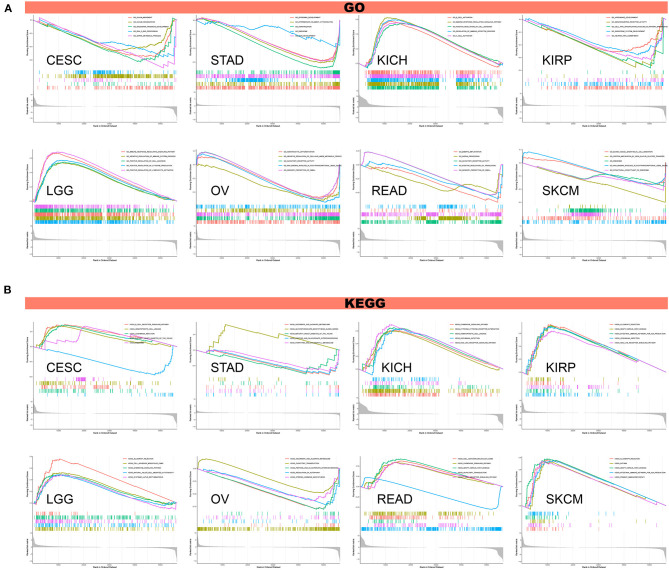
Figure 13.
Results of GSEA. (A) GO functional annotation of TREM2 in various cancers. (B) KEGG pathway analysis of TREM2 in multiple cancers. Curves of different colors show different functions or pathways regulated in different cancers. Peaks on the upward curve indicate positive regulation and peaks on the downward curve indicate negative regulation.

