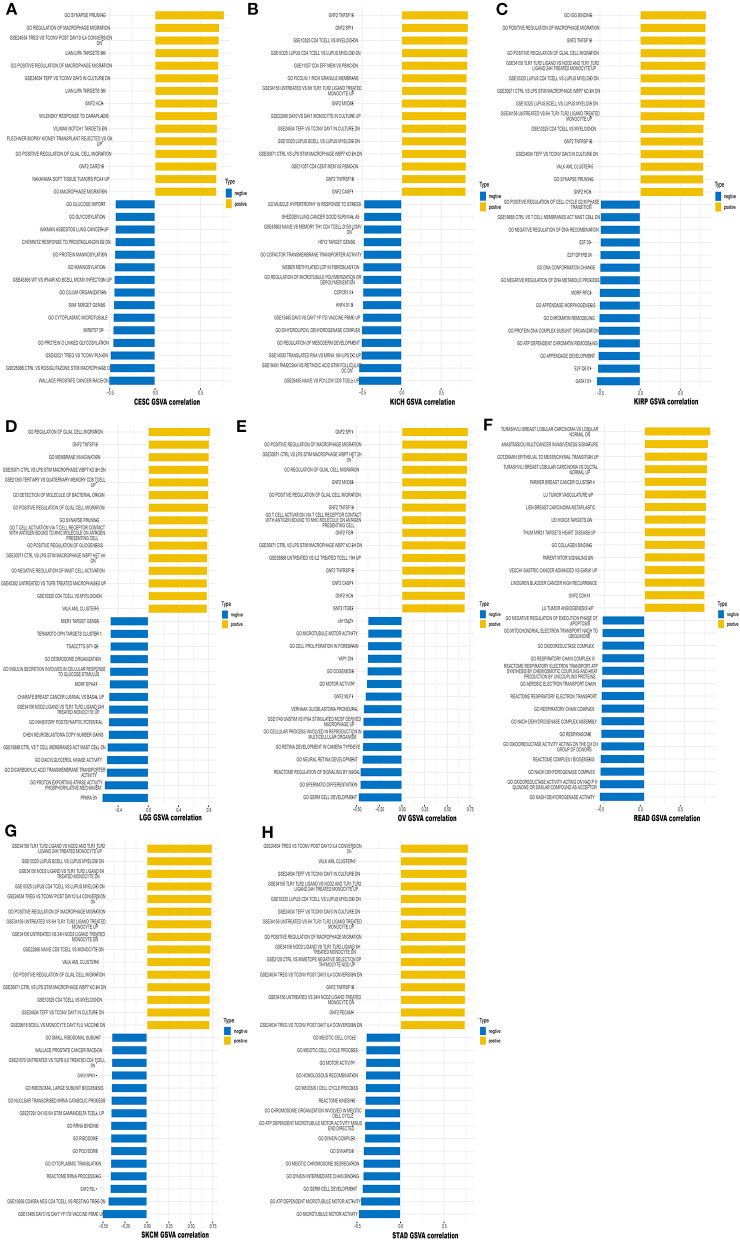
Figure 14.
Results of GSVA. Yellow bars show the 15 pathways with the most significant positive correlation and blue bars show the 15 pathways with the most significant negative correlations. Horizontal axis represents the correlation coefficient. (A) Cervical squamous cell carcinoma and endocervical adenocarcinoma (CESC). (B) Kidney chromophobe (KICH). (C) Kidney renal papillary cell carcinoma (KIRP). (D) Brain lower grade glioma (LGG). (E) Ovarian serous cystadenocarcinoma (OV). (F) Rectum adenocarcinoma (READ). (G) Skin cutaneous melanoma (SKCM). (H) Stomach adenocarcinoma (STAD).

