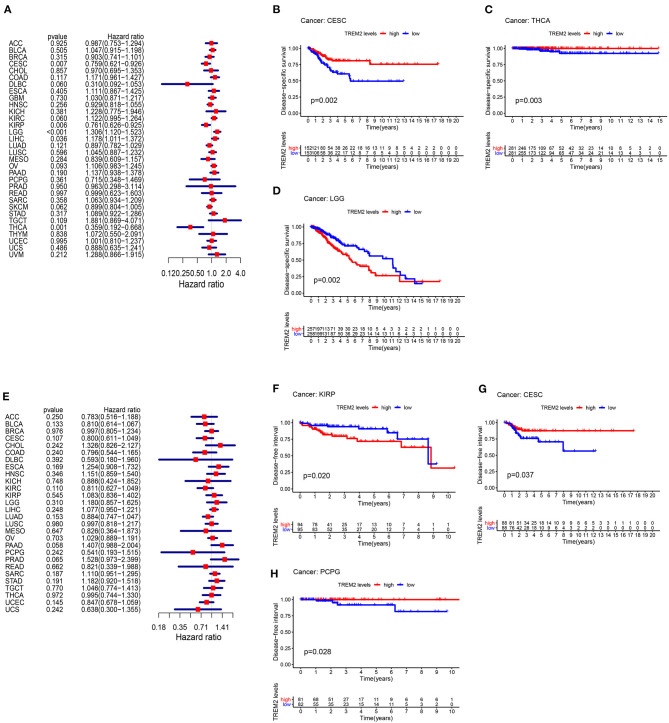
Figure 4.
Association between TREM2 expression levels and disease-specific survival (DSS) and disease-free interval (DFI). (A) Forest plot of association of TREM2 expression and DSS in 33 types of tumor. (B–D) Kaplan-Meier analysis of the association between TREM2 expression and DSS. (E) Forest plot of association of TREM2 with DFI for 33 types of tumor. (F–H) Kaplan-Meier analysis of the association between TREM2 expression and DFI.

