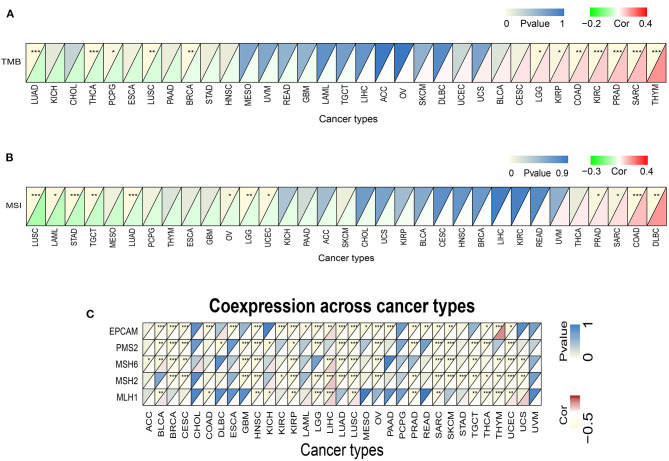
Figure 8.
Associations between TREM2 expression and tumor mutational burden (TMB), microsatellite instability (MSI), and mismatch repair (MMR). (A) Heatmap illustrating the relationship between TREM2 and TMB. The top left triangle represents the P-value, and the bottom right triangle represents the correlation coefficient *p < 0.05, **p < 0.01, and***p < 0.001. (B) Heatmap illustrating the relationship between TREM2 and MSI. The top left triangle represents the P-value, and the bottom right triangle represents the correlation coefficient *p < 0.05, **p < 0.01, and ***p < 0.001. (C) Heatmap illustrating the association between TREM2 expression and MMR genes. For each pair, the top left triangle represents the P-value, and the bottom right triangle represents the correlation coefficient *p < 0.05, **p < 0.01, and ***p < 0.001.

