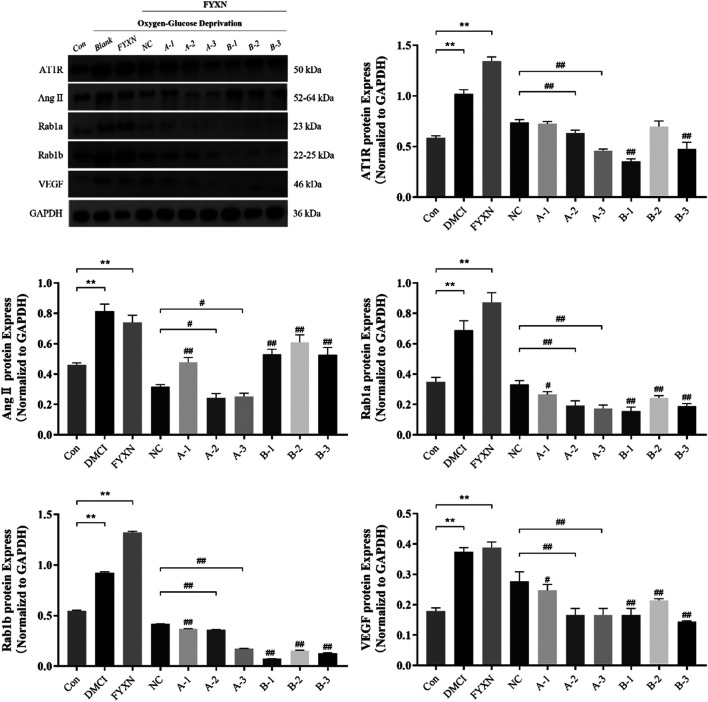
FIGURE 12.
The expression levels of angiogenesis-associated proteins (AT1R, Ang II, Rab1a, Rab1b, VEGF) after interference with Rab1a and Rab1b in vitro. The Rab1a siRNA sequences of A1, A2 and A3, and the Rab1b siRNA sequences of B1, B2 and B3. *p < 0.05, **p < 0.01, compared with control group; #p < 0.05, ##p < 0.01, compared with NC group.

