FIGURE 3.

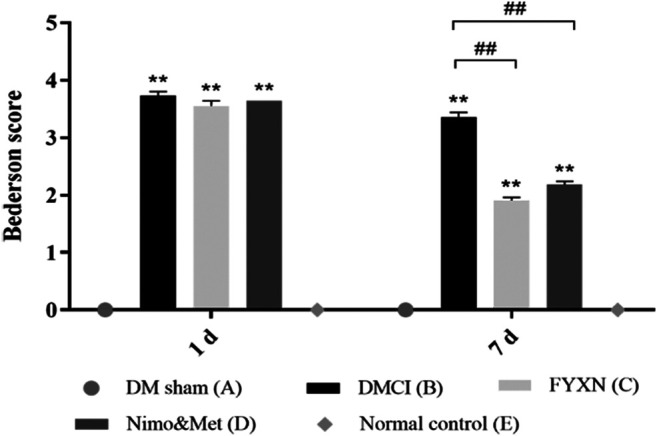
Neurological functional results. Data of neurological deficit scores are shown as mean ± SD in each group. *p < 0.05, **p < 0.01 compared with NC group; #p < 0.05, ##p < 0.01 compared with DMCI group.

Neurological functional results. Data of neurological deficit scores are shown as mean ± SD in each group. *p < 0.05, **p < 0.01 compared with NC group; #p < 0.05, ##p < 0.01 compared with DMCI group.