FIGURE 3.
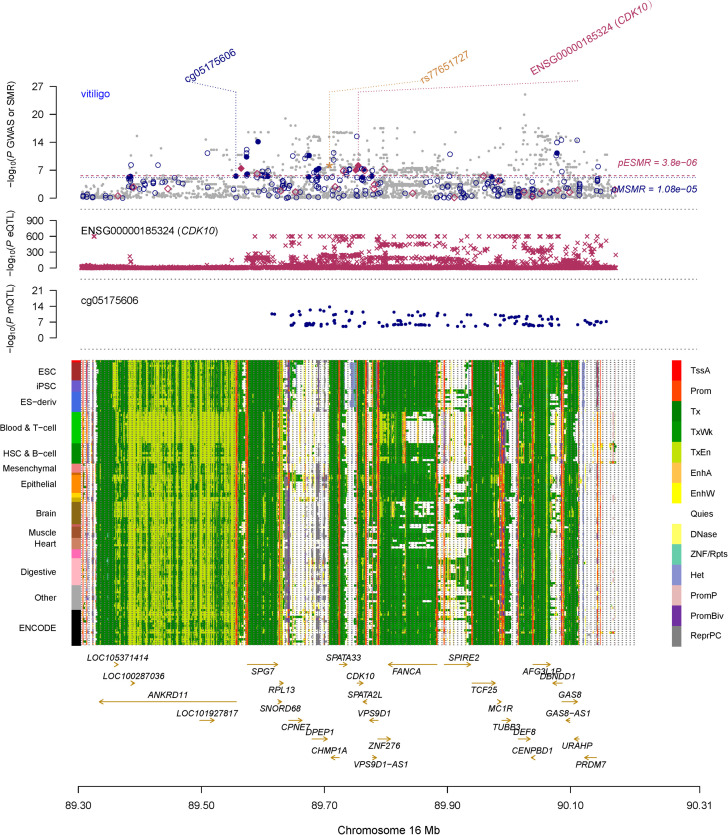
Prioritizing CDK10 and cg05175606 for vitiligo. The top plot shows –log10(P-value) of SNPs from GWAS for vitiligo. The red diamonds and blue circles represent –log10(P-values) from SMR tests for associations of vitiligo with gene expression and DNAm probes, respectively. The solid circles and diamonds are the probes not rejected by the HEIDI test, the yellow star indicates the top-associated variant rs77651727 in the eQTL analysis of the CDK10 and the meQTL analysis of the cg05175606. The second plot shows –log10(P-values) from the eQTLGen dataset for associations of SNPs with gene expression probe ENSG00000185324 (tagging CDK10). The third plot shows –log10(P-values) from meQTL study for associations of the SNPs with DNAm probes (cg05175606). The bottom plot shows 14 chromatin state annotations (indicated by colors) of 127 samples from REMC for different primary cells and tissue types (rows). TSSA, active TSS; Prom, promoter, Tx, active transcription; TxWk, weak transcription; TxEn, transcribed and regulatory promoter/enhancer; EnhA, active enhancer; EnhW, weak enhancer; DNase, primary DNase; ZNF/Rpts, ZNF genes and repeats; Het, heterochromatin; PromP, poised promoter; PromBiv, bivalent promoter; ReprPC, repressed PolyComb; Quies, quiescent/low.

