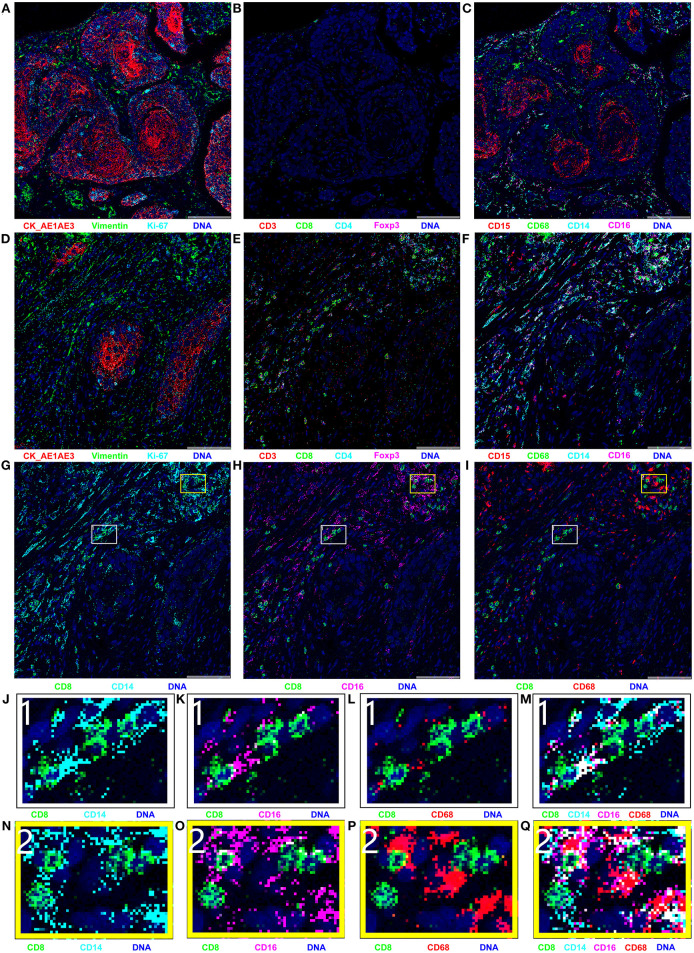
Figure 3.
Results of imaging mass cytometry (IMC); all markers were stained in the same paraffin section and were present in different combinations. (A–C) IMC imaging of treatment-naïve specimen; (D–Q) IMC imaging of surgical specimen. The naïve specimen was mainly composed of cancer cells, with hardly any immune cell infiltration. Compared with the naïve specimen, the surgical specimen contained few cancer cells and was mainly infiltrated with CD8+ T cells, CD14+ monocytes, CD16+ monocytes, and CD68+ macrophages. (G–I) Spatial relationships between CD8+ T cells and CD14+ monocyte, CD16+ monocyte, and CD68+ macrophages. (J–Q) Enlarged versions of images in parts (G–I).

