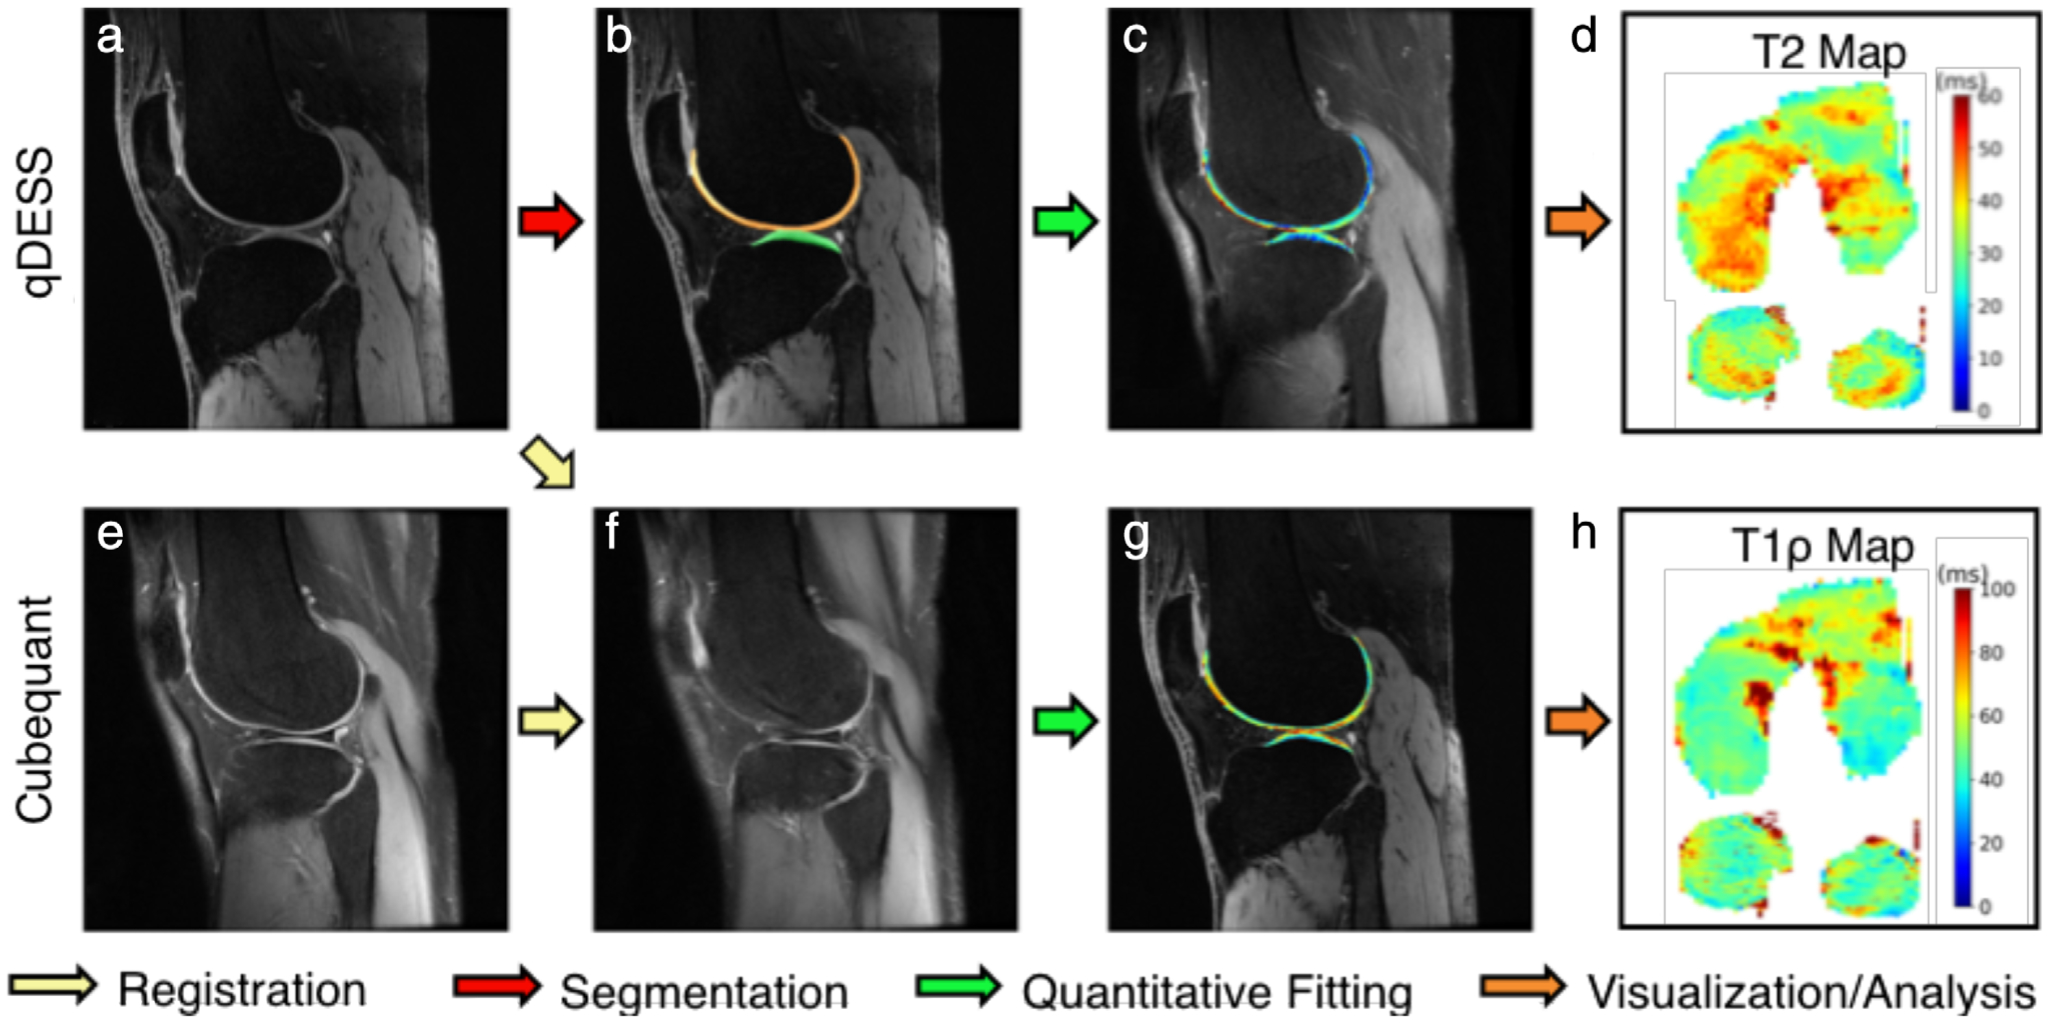
FIGURE 12:

A sample analysis workflow using the fully-automated deep open source musculoskeletal analysis (DOSMA) framework. DOSMA automates tissue segmentation (red arrow), interscan registration (yellow arrow), quantitative fitting (green arrow), and visualization and region subdivision (orange arrow). In this example, qDESS scans (a) are used to automatically segment femoral and tibial cartilage (b) and analytically solve for T2 maps in each region (c,d). Corresponding CubeQuant scans for T1ρ relaxation time generation (e) are registered to the high-resolution qDESS scans (f) and used to fit T1ρ maps (g). Quantitative maps with 3D quantitative information are projected into 2D planes to visualize the femoral and tibial cartilage surfaces (d,h). Image courtesy Arjun Desai, Stanford University, Stanford, CA.
