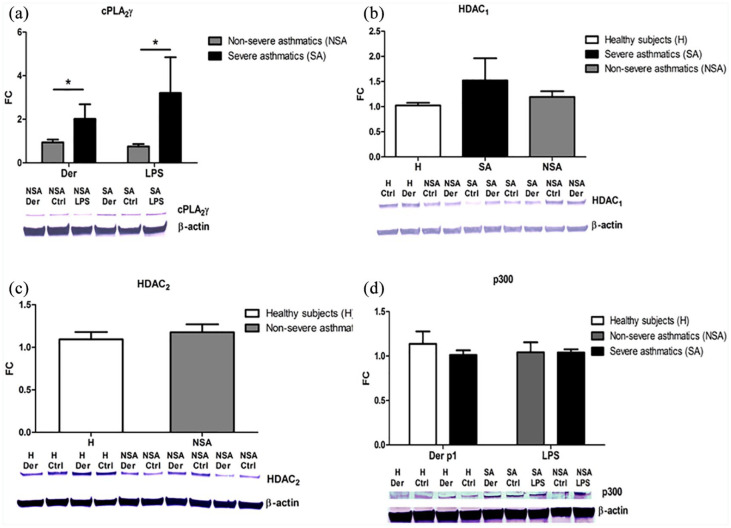
Figure 3.
Relative cPLA2γ (a), HDAC1 (b), HDAC2 (c), p300 (d) protein expression. PBMC from severe (black bar), non-severe asthmatics (gray bar) and healthy subjects (white bar) were in vitro stimulated with nDer p1 or LPS. Each sample of all participants was analyzed by Western Blot six times showing similar results, and the blots presented are representatives. The box-plots present densitometry results. Data presented as fold change in comparison to the vehicle-treated cells (control) both normalized to β-actin. Data represent the mean ± SEM.
*P < 0.05 as comparison between studied groups.

