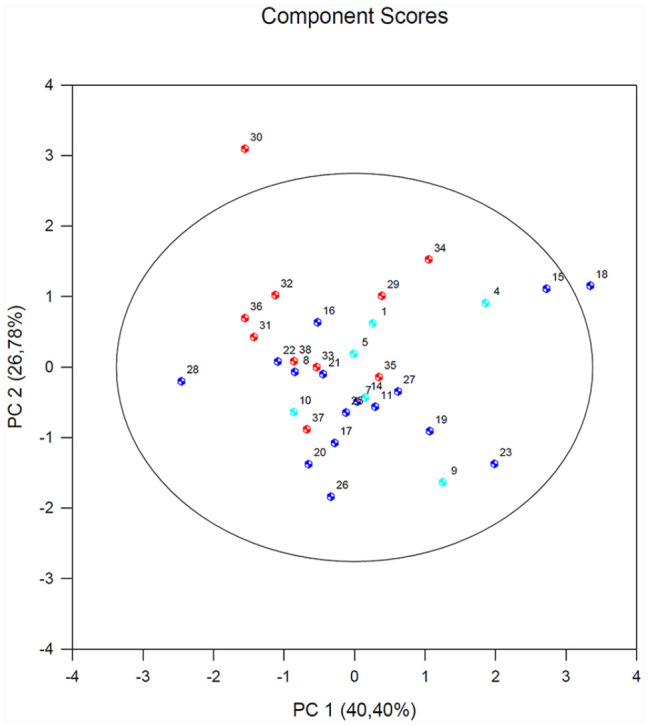
Figure 4.

Results of PCA in the PBMCs after stimulation with nDER p1 for all subjects. A biplot of individual subjects according to their scores of the first (PC1) and second (PC2) principal component (with prediction ellipse 95%). The HA group (healthy subjects; 1–13) is marked in turquoise; the NSA group (non-serve asthmatics; 14–28) is marked in navy blue; and the SA group (serve asthmatics; 29–39) is marked in red.
