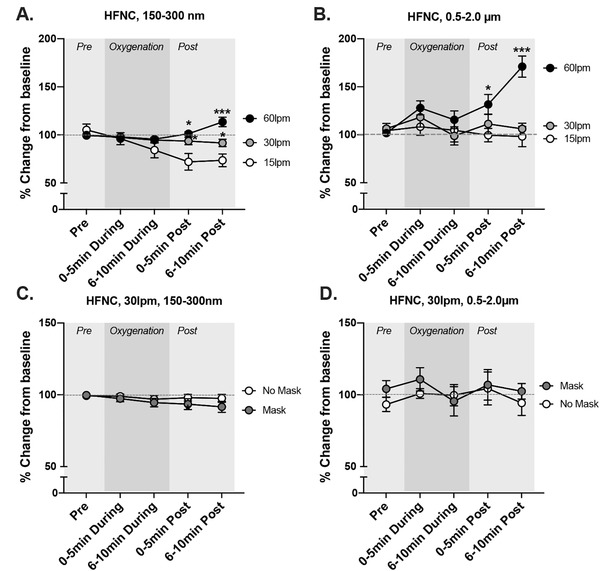
FIGURE 3.

Relative changes in aerosols (150–300 nm) and droplets (0.5–2.0 μm) during various oxygenation strategies. (A) The effects of flow rate on 150–300 nm aerosol formation from a high‐flow nasal cannula (HFNC), while wearing a procedural mask. (B) The effects of flow rate on aerosols in the range of 0.5–2.0 μm from a HFNC, while wearing a procedural mask. (C) At 30 liters per minute (LPM) for HFNC, the comparisons of particulate matter (PM) generation with and without a procedural mask in place for 150–300 nm particulates. (D) At 30 LPM for HFNC, the comparisons of PM generation with and without a procedural mask in place for 0.5–2.0m μm particulates. Data shown are mean ± SEM. Asterisks indicate significant difference from 15 LPM trial at specific time points by a 2‐way repeated measures analysis of variance (*P < 0.05, **P < 0.01, ***P < 0.001)
