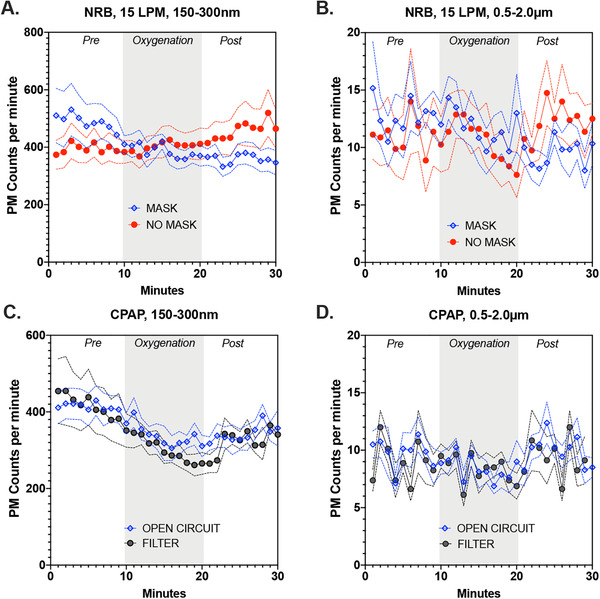
FIGURE 4.

Absolute value of particulate counts per minute for the 2 size fractions (150–300 nm) and (0.5–2.0 μm) during various oxygenation strategies. (A) The effects of procedural mask usage on 150–300 nm aerosol formation from a non‐rebreather mask (NRB) at 15 liters per minute (LPM). (B) The effects of procedural mask usage on 0.5–2.0 μm aerosol formation from a NRB at 15 LPM. (C) The effects of internal filtration of a continuous positive airway pressure (CPAP) device on subject‐derived 150–300 nm aerosol formation. (D) The effects of internal filtration of a CPAP device on subject‐derived 0.5–2 μm aerosol formation. Data shown are mean ± SEM. PM, particulate matter
