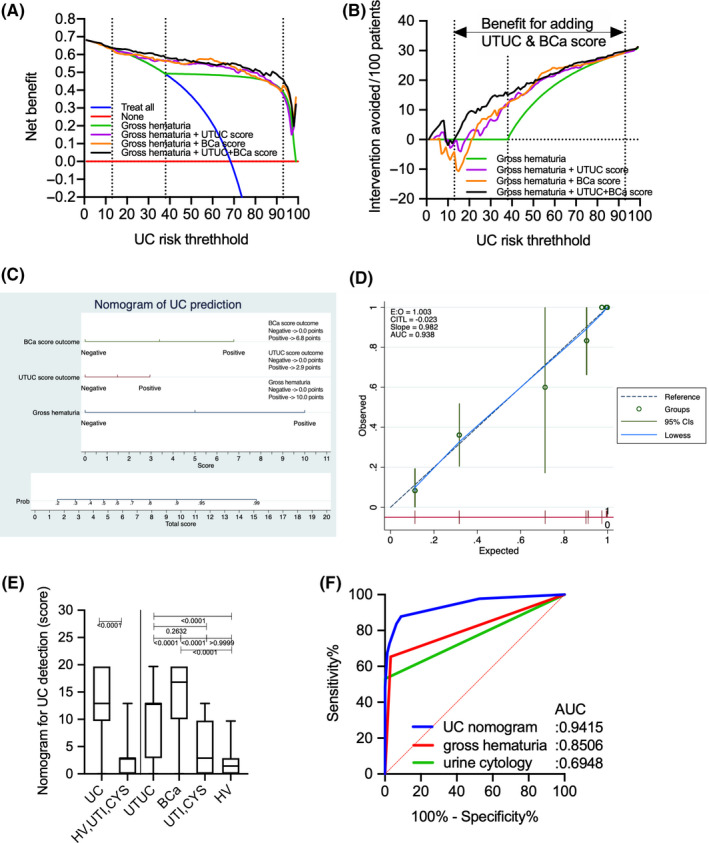
FIGURE 7.

Comparison of decision curve plots with net benefit for the relevant risk threshold between the base model (gross hematuria), base model +upper urinary tract urothelial carcinoma score, base model +bladder cancer score, and base model +upper urinary tract urothelial carcinoma +bladder cancer scores in the training cohort. (A) Decision curve plots showing the net benefit for detecting urothelial carcinoma (UC). (B) Decision curve plots showing the intervention avoided per 100 patients; plots were developed using the rmda package of R statistical software. (C) Logistic regression analysis‐based nomogram for the prediction of UC. (D) Calibration plot depicting the calibration of the UC nomogram. (E) Boxplot of UC and non‐UC (HV, UTI, and CYS) based on the UC nomogram, gross hematuria, and urine cytology. (F) Receiver operating characteristic curve analysis of the UC nomogram, gross hematuria, and urine cytology for the prediction of UC. UC, urothelial carcinoma; BCa, bladder cancer; HV, healthy volunteer; UTI, urinary tract infection.
