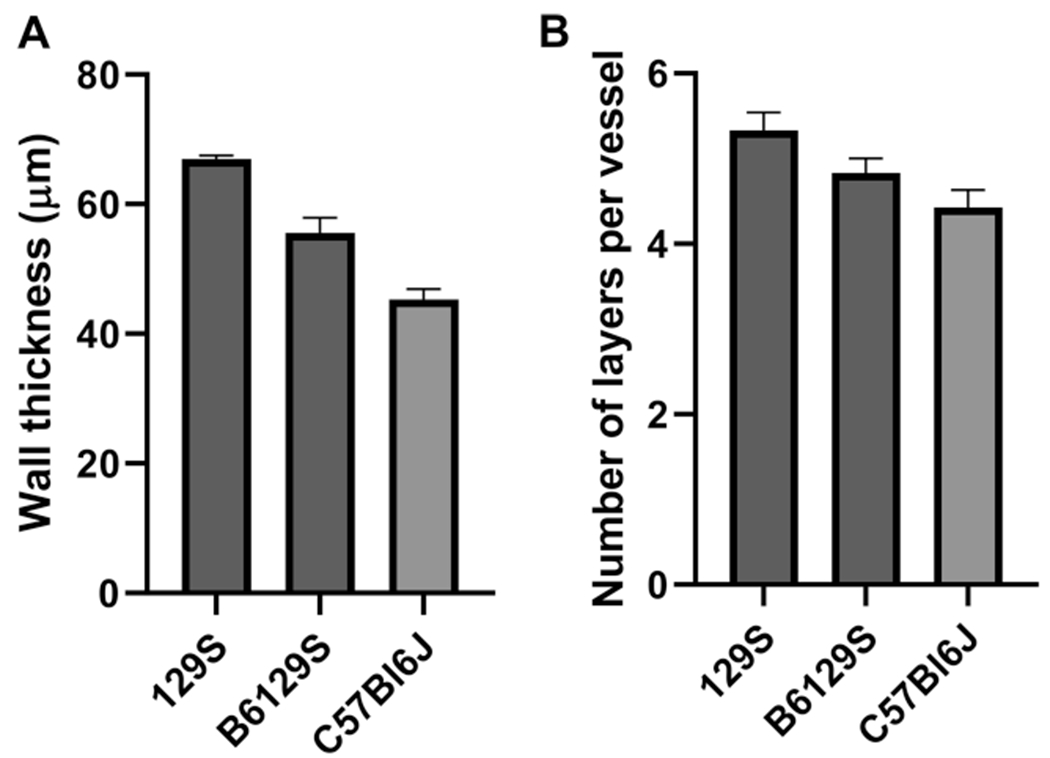
Fig. 6.

Bar graphs of wall thickness and number of vessel layers. a The mouse strains exhibited significant differences in vessel wall thickness, with 129S mice having the thickest vessel walls and C57Bl/6J mice having the thinnest. b Mean number of distinct lamellar units (layers) was also different (n = 5 mice per group for each stain)
