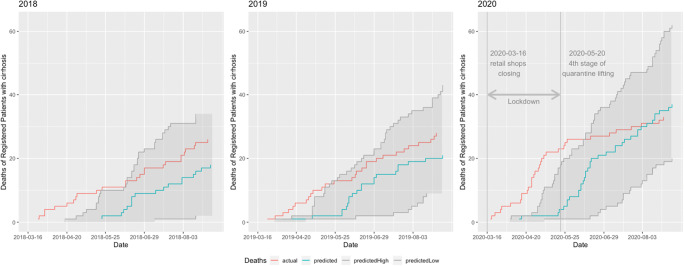
Fig. 3.
Actual deaths versus median predicted deaths. All-cause mortality in the ACLD registry RH7. The lines display actual deaths versus median predicted deaths. Actual deaths in 2018 and 2019 (left and middle panes) were within the 95% confidence interval. In the spring of 2020, the number of actual deaths sharply increased and was above the numbers predicted by Cox proportional hazard model, showing excess mortality (19 excess deaths in 2020 in comparison to 10 in 2018 and 10 in 2019) indicating the negative secondary impact of initial pandemic measures on tertiary cirrhosis care

