-
A
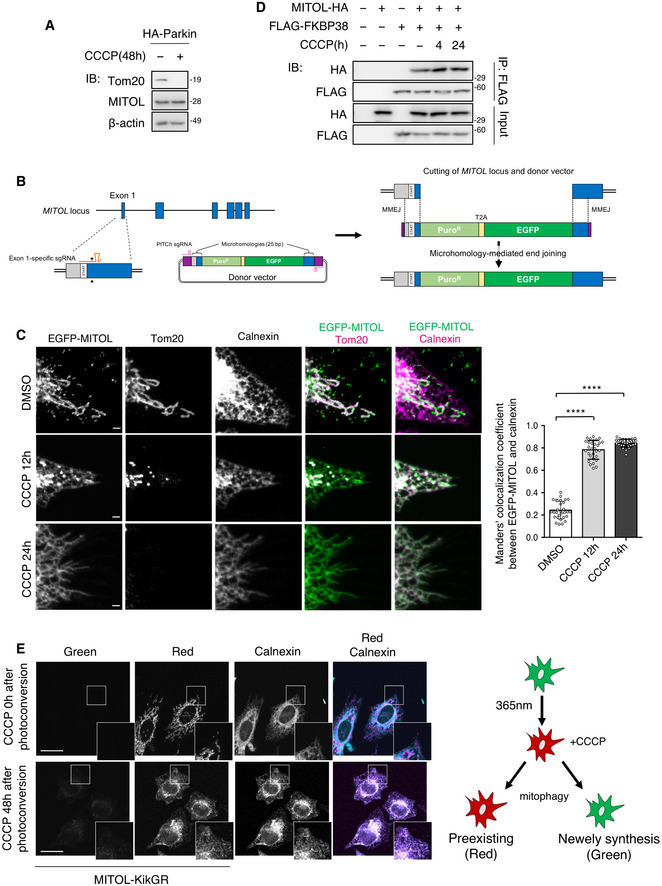
MITOL was not degraded in mitophagy. HeLa cells stably expressing HA‐Parkin were treated with DMSO or CCCP (10 μM) for 48 h and subjected to an IB assay with the indicated antibodies.
-
B
Schematic diagram of EGFP knock‐in for N‐terminal tagging. MITOL‐specific and PITCh‐specific sgRNAs expressed from pX330A‐MITOL/PITCh (not shown) individually target the MITOL exon 1 locus and the donor vector. This allows for both the cleavage of the genomic locus and the release of the EGFP‐containing cassette. MMEJ leads to the repair of double‐strand break via the insertion of the EGFP‐containing cassette, resulting in endogenously EGFP tagged MITOL.
-
C
Endogenous MITOL translocates to the ER in later phase of mitophagy. EGFP‐MITOL knock‐in HeLa cells were transfected with HA‐Parkin and treated with DMSO or CCCP (10 μM) as indicated times. Cells were fixed, permeabilized, and subjected to immunofluorescence analysis with the indicated antibodies. Colocalization was quantified by Manders’s coefficient. Means ± SEM of more than 10 cells obtained from three independent experiments. For statistical analysis, a one‐way ANOVA with Tukey's multiple comparisons test was performed, ****P < 0.0001. Scale bar represents 1 μm.
-
D
MITOL interacts with FKBP38. HeLa cells or HeLa cells stably expressing mCherry‐Parkin were transfected with the indicated vectors and treated with DMSO or CCCP (10 μM) for indicated times. Lysates of cells were subjected to an IP‐IB assay with the indicated antibodies.
-
E
ER‐localized MITOL is transported from the mitochondria and is not newly synthesized protein. HeLa cells stably expressing HA‐Parkin were co‐transfected with vectors for MITOL‐KikGR and FLAG‐FKBP38. After ultraviolet light (365 nm) exposure to the whole plate, cells were incubated with or without CCCP (10 μM) for indicated time, and monitored for red and green KikGR fluorescence. Scale bar, 10 μm. Higher magnification images of the boxed regions are shown in the small panel. Right panel is schematic experimental model for KikGR in this study.

