-
A
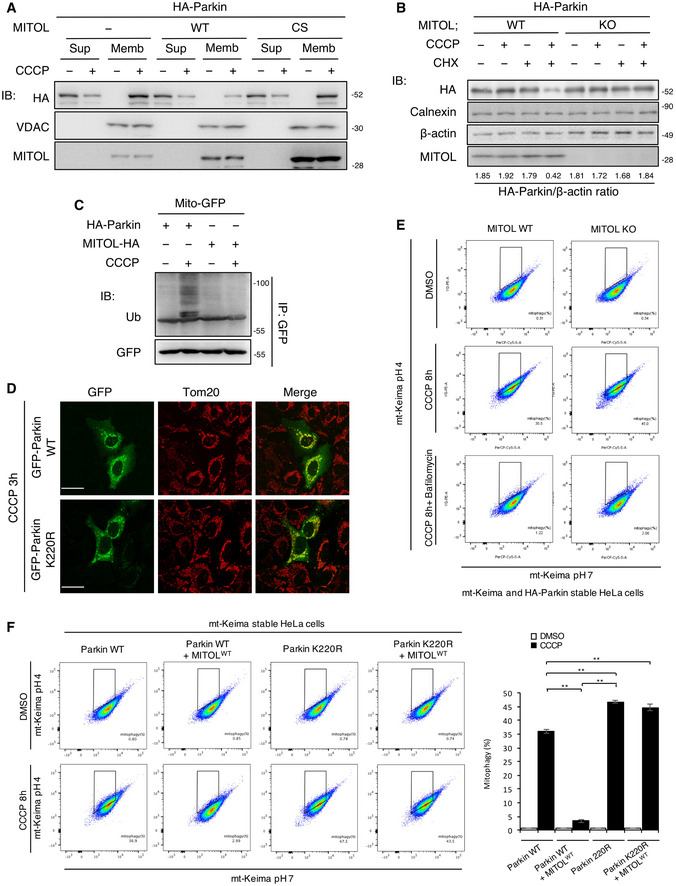
MITOL overexpression degrades Parkin on mitochondrial membrane. HeLa cells stably expressing HA‐Parkin were transfected with the indicated vectors and treated with DMSO or CCCP (10 μM) for 12 h. Lysates of cells were fractionated into mitochondria‐rich membrane fraction (Memb) and supernatant (Sup), and then subjected to an IB assay with the indicated antibodies. Loading was adjusted for approximately equal concentrations of VDAC in the membrane fraction (Memb).
-
B
Endogenous MITOL attenuates mitophagy in CHX‐treated cells. WT or MITOL KO HeLa cells stably expressing HA‐Parkin were treated with DMSO or CCCP (10 μM) for 30 h. CHX (30 μM) was added 5 h after CCCP treatment. Lysates of cells were subjected to an IB assay with the indicated antibodies.
-
C
MITOL has the specificity for the substrate. HeLa cells were transfected with the indicated vectors and treated with DMSO or CCCP (10 μM) for 8 h. MG132 (30 μM) was added 3 h after each treatment. Lysates of cells were subjected to an IP‐IB assay with the indicated antibodies and compared ubiquitination levels of HA‐Parkin and MITOL‐HA to Mito‐GFP.
-
D
Parkin K220R mutant normally translocated to the mitochondria in CCCP‐treated cells. HeLa cells were transfected with indicated vectors and treated with CCCP (10 μM) for 3 h. Cells were immunostained with indicated antibody. Scale bar, 10 μm.
-
E
Mt‐Keima signal is responding to autophagy process. MITOL WT HeLa cells and MITOL KO HeLa cells expressing HA‐Parkin and mt‐Keima were treated with DMSO or CCCP (10 μM) for 8 h alone or either with bafilomycin A1 (10 μM). Then, mKeima was measured at 488 (pH 7) and 561 (pH 4) nm lasers using Flow Cytometer. Percentages of mitophagy were calculated from 30,000 cells.
-
F
Parkin K220R mutant induces mitophagy even in the overexpression of MITOL. HeLa cells stably expressing mt‐Keima were transfected with indicated vectors and treated with CCCP (10 μM) for 8 h. Then, mKeima was measured at 488 (pH 7) and 561 (pH 4) nm lasers using Flow Cytometer. Percentages of mitophagy were calculated from 30,000 cells in each independent experiment. Data represent the mean ± SD of three independent experiments. For statistical analysis, a one‐way ANOVA with Tukey post‐test was performed, **P < 0.01.

