
Figure EV5. FUNDC1‐dependent mitophagy controls mitochondrial quality.
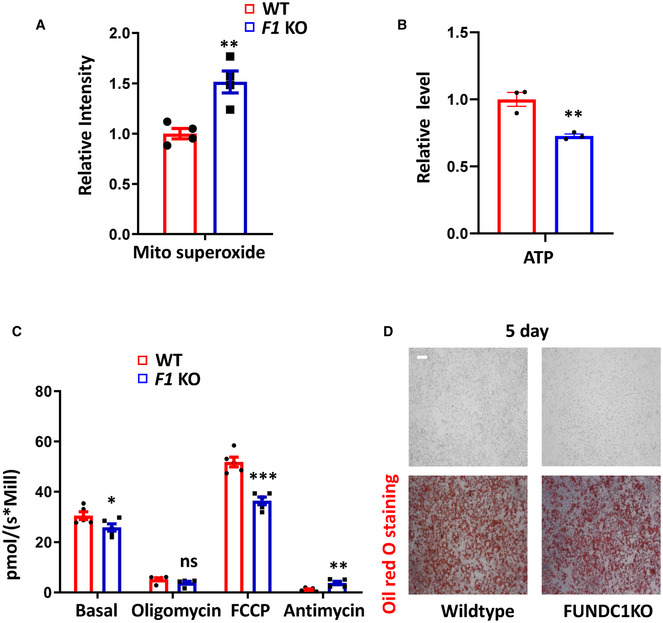
- Mitochondrial ROS levels were measured by Mito‐Sox staining in WT and Fundc1 knockout (F1 KO) brown fat preadipocytes. Data information: Experiments were repeated four times, and data are represented as the mean ± SEM. Statistical analysis was performed using two‐tailed Student's t‐test. **P < 0.01.
- ATP levels were measured with a luciferase assay kit in WT and Fundc1 KO preadipocytes. Data information: Experiments were repeated three times, and data are represented as the mean ± SEM. Statistical analysis was performed using two‐tailed Student's t‐test. **P < 0.01.
- OCR was measured in WT and Fundc1 KO preadipocytes. Data information: Experiments were repeated four times, and data are represented as the mean ± SEM. Statistical analysis was performed using two‐tailed Student's t‐test. *P < 0.05; **P < 0.01; ***P < 0.001.
- Oil red O staining analysis of wild‐type and Fundc1 KO brown fat cells after differentiation for 5 days, scale bar, 10 μm.