
Figure 3.
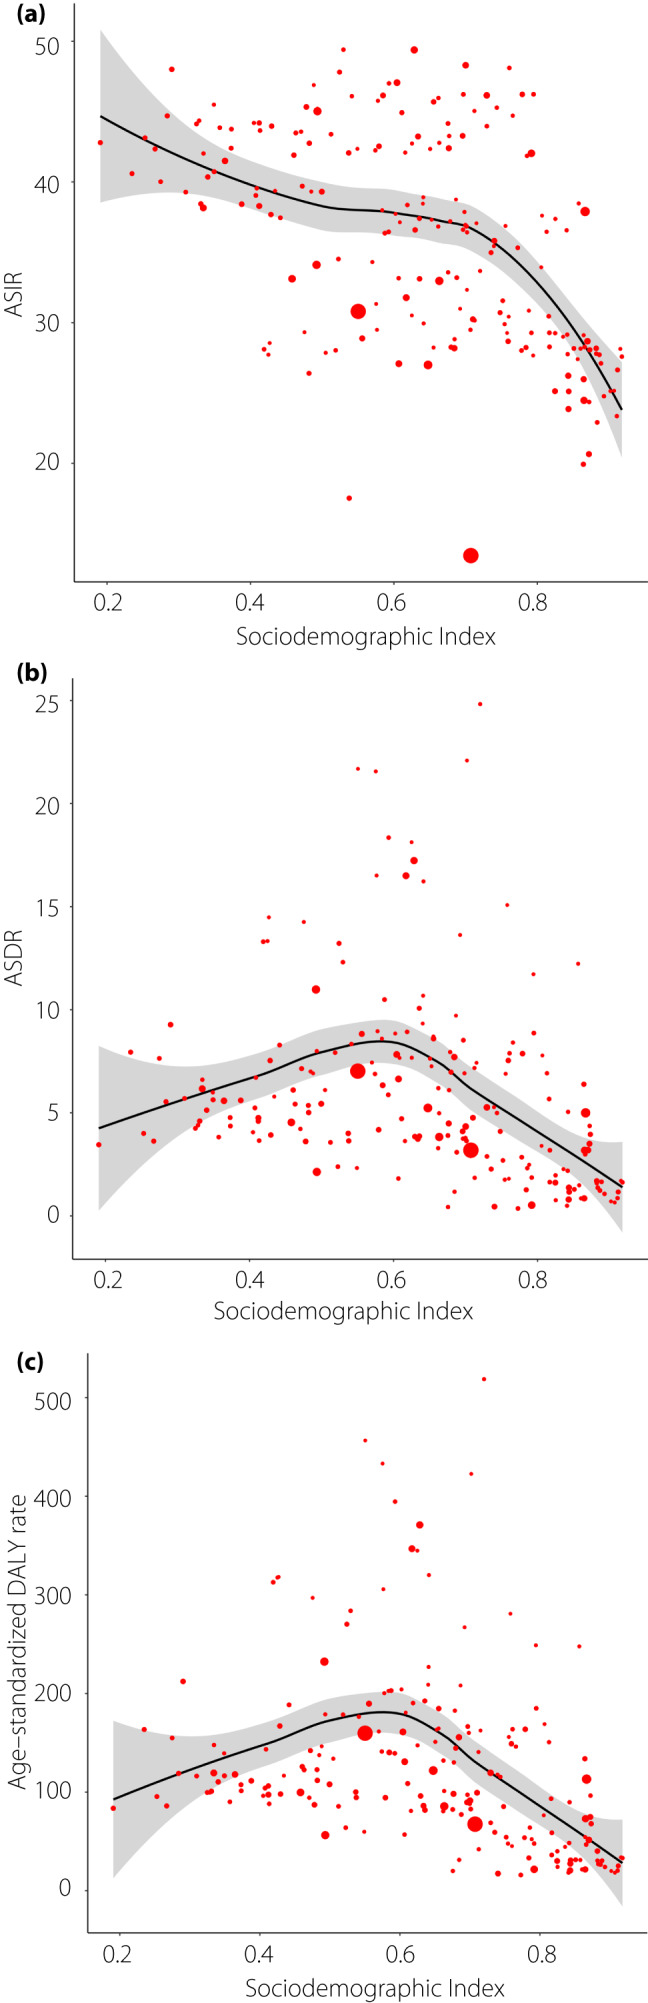
The association between (a) age‐standardized incidence, (b) death, (c) disability‐adjusted life year (DALY) rate and Sociodemographic Index. (a) ρ = −0.52, P < 0.001; (b) ρ = −0.27, P < 0.001; (c) ρ = −0.30, P < 0.001; Each circle represents a country; circle size corresponds to population number. The P indices and ρ values were derived from Pearson’s correlation analysis.