
Figure 3. Simultaneous visualisation of histone marks and Xist RNA in living cells.
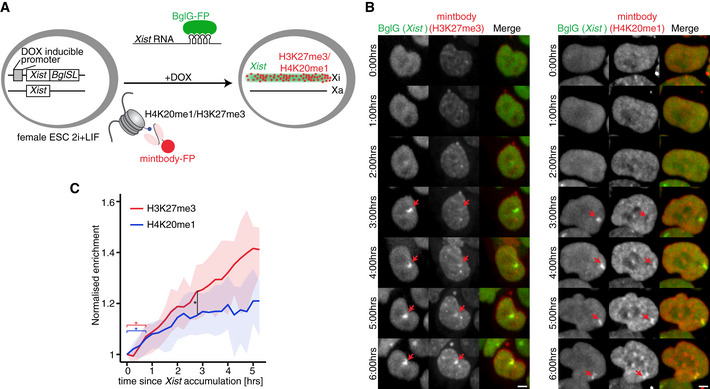
- Schematic representation of the experimental design. Female mouse ESC line was used, in which Xist can be induced from one allele (TX1072) and this allele also harbours an array of 18 Bgl stem loops (BglSL) inserted into the 7th exon of Xist gene. BglG fused to a fluorescent protein (GFP or mCherry) detects Xist RNA as it binds to BglSL. Cells also stably express a mintbody allowing the detection of H3K27me3 (GFP) or H4K20me1 (mCherry).
- Cells were treated with DOX to induce Xist expression and time‐lapse imaging was performed with images acquired every 15 min. Maximum intensity projection images are shown with elapse time (hh:mm). Arrowheads mark Xi accumulating Xist RNA. Scale bar = 5 μm.
- Live imaging analysis of average H3K27me3 (red) and H4K20me1 (blue) accumulation at the Xi. Average normalised mintbody enrichment is shown with shading representing 25 and 75 quartiles. Signal was calculated starting from the first accumulation of Xist RNA. At least 30 cells were analysed. *unpaired t‐test P‐value < 0.05.