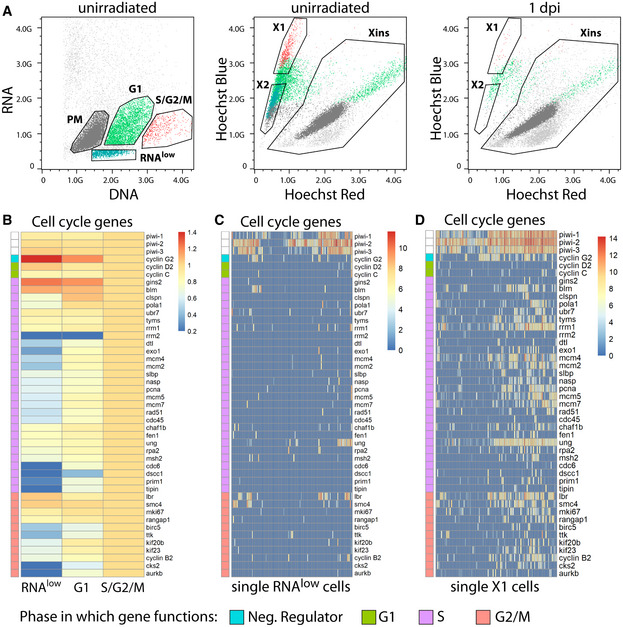
Figure EV1. Backgating and RNA‐sequencing of DNA/RNA FACS gates.

-
ABackgating of the RNAlow, G1, S/G2/M, and PM populations from Hoechst/pyronin Y stained cells (left) onto a classic Hoechst side population plot (middle, unirradiated; right, 1 day post 60 Gy irradiation). Plots are representative of n > 3 independent experiments.
-
BExpression of cell cycle genes in bulk RNAseq data of RNAlow, G1 and S/G2/M cells. Heatmap scale, fold change of log2 normalized expression compared to S/G2/M.
-
C, DExpression of cell cycle genes in scRNAseq of 96 RNAlow neoblasts (C) or 96 previously sequenced X1 neoblasts (D, data ref: Molinaro & Pearson, 2016). Heatmap scale, log2 normalized expression level.
Data information: In (B–D), the cell cycle phase in which each gene primarily functions is indicated by the colour bar along the left side of each heatmap.
