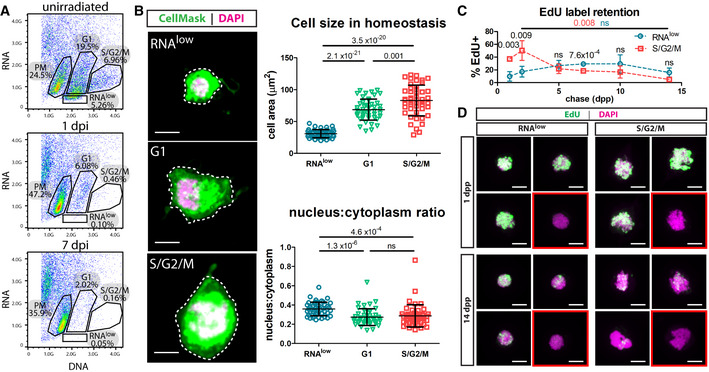
Figure 2. Sorting neoblasts by DNA/RNA content reveals a relatively slow‐cycling population.

- Dissociated cells from unirradiated, 1 dpi or 7 dpi animals (60 Gy of irradiation) were stained with Hoechst (DNA) and Pyronin Y (RNA) and sorted by FACS to reveal an RNAlow population. Percentages indicate the proportion of events within each gate.
- Cell size and nucleus:cytoplasm ratio measured by CellMask (cytoplasm) and DAPI (nucleus) staining of FACS sorted cells at homeostasis (n ≥ 47 per sample). Representative images are shown, with dashed lines to indicate the area measured. Scale bars, 5 µm.
- EdU pulse‐chase time course of label retention in sorted RNAlow and S/G2/M neoblasts (n ≥ 3 individual experiments per time point). Red and blue P values indicate the statistical significance of EdU dilution from 2 to 14 dpp in S/G2/M or RNAlow neoblasts, respectively. Black P values indicate the statistical significance of EdU retention in RNAlow neoblasts compared to S/G2/M neoblasts.
- Maximum projection confocal images showing examples of cells from the beginning and end of the EdU label‐retention time course in (C). Red boxes denote examples of EdU− cells. Scale bars, 5 µm.
Data information: Data in (B and C) are presented as mean ± s.d. Statistical significance was assessed using Welch's t‐tests (P values are indicated; ns, not significant [P > 0.05]). Data are representative of ≥ 3 independent experiments.
