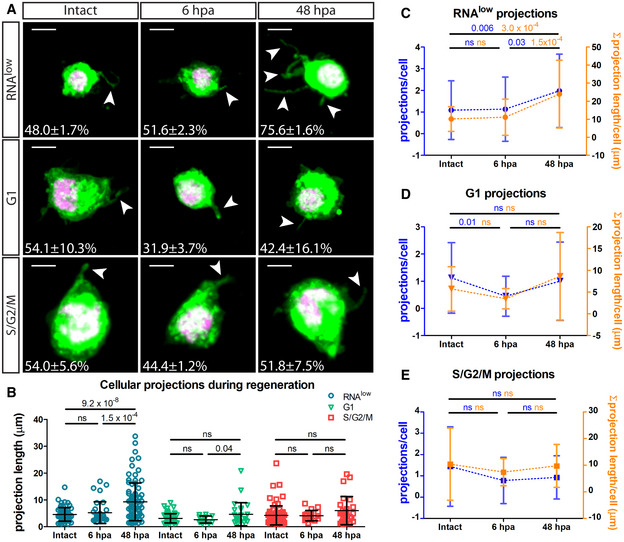
Figure 4. RNAlow neoblasts extend projections following amputation.

-
ARepresentative images of RNAlow, G1 and S/G2/M cells stained with CellMask and DAPI in intact animals and at 6 and 48 hpa. All images shown are from samples processed in the same experiment. Intact images are duplicated from Fig 2B. White arrows mark projections. Percentage of cells displaying projections in each condition is noted (n > 100 cells counted). Scale bars, 5 µm.
-
BAverage projection length in RNAlow, G1 and S/G2/M cells from intact animals and at 6 and 48 hpa (n ≥ 13).
-
C–EQuantification of the number of projections per cell (blue data) and the sum total projection length per cell (orange data) in RNAlow (C), G1 (D) or S/G2/M (E) cells isolated from intact animals and at 6 and 48 hpa (n ≥ 23 for projections/cell, n ≥ 10 for Σ projection length/cell).
Data information: Data are presented as mean ± s.d. Statistical significance was assessed using Welch's t‐tests (P values are indicated; ns, not significant [P > 0.05]). Data are representative of two independent experiments.
