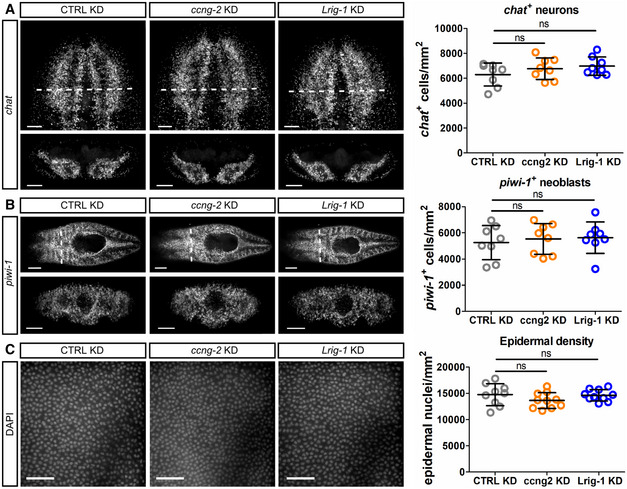
Figure EV5. No effect of Lrig‐1 knockdown on differentiation at homeostasis.

-
A–CRepresentative confocal images and quantifications of chat + neurons (A), piwi‐1 + neoblasts (B) and cell nuclei in the epidermis marked by DAPI (C) following control, ccng2, or Lrig‐1 knockdown at homeostasis (n = 8 technical replicates for all). Scale bars, 100 µm in (A); 250 µm in (B) (top panels) and 100 µm in (B) (bottom panels); 50 µm in (C).
Data information: Data presented as mean ± s.d. Statistical significance was assessed using Welch's t‐tests (ns, not significant [P > 0.05]). Animals were fixed at 5fd5. In (A and B), images are maximum projections and bottom panels are cross‐sections taken from the region indicated by the dashed white lines in the corresponding top panel. In (C), images are single confocal planes at the level of the epidermis. The data are representative of one independent experiment.
