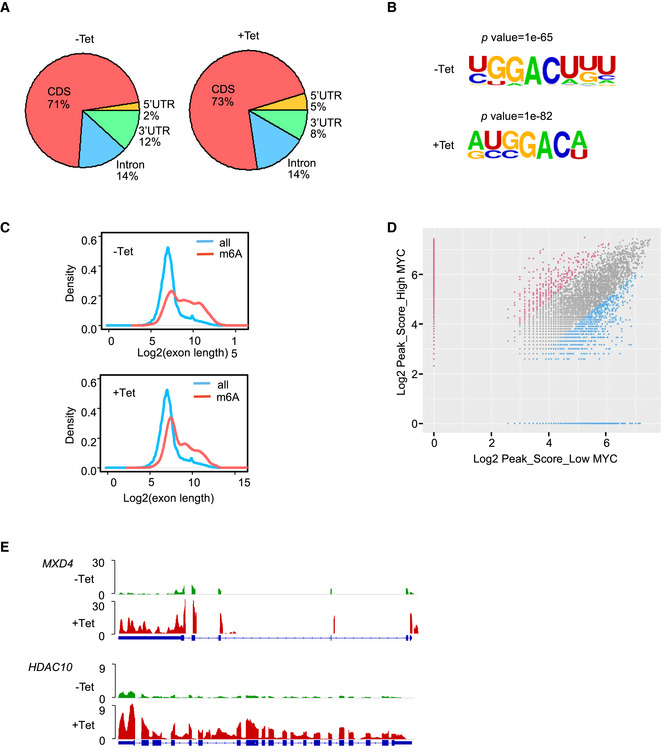
Figure EV1. MeRIP analyses show that MYC down‐regulates m6A levels of mRNA.

- Pie chart depicting the fraction of m6A peaks in four transcript segments in P493‐6 cells treated with Tet for 0 h or 72 h.
- Sequence motif identified within m6A peaks by HOMER database.
- Distribution of m6A sites along the length of mRNA transcripts.
- Scatter plots showing the m6A enrichment in mRNA of high MYC and low MYC samples. m6A‐containing mRNA with significantly increased and decreased peak enrichment is highlighted in red and green, respectively (chi‐square test, P < 0.05).
- IGV graph showing location of m6A peaks on representative genes.
