
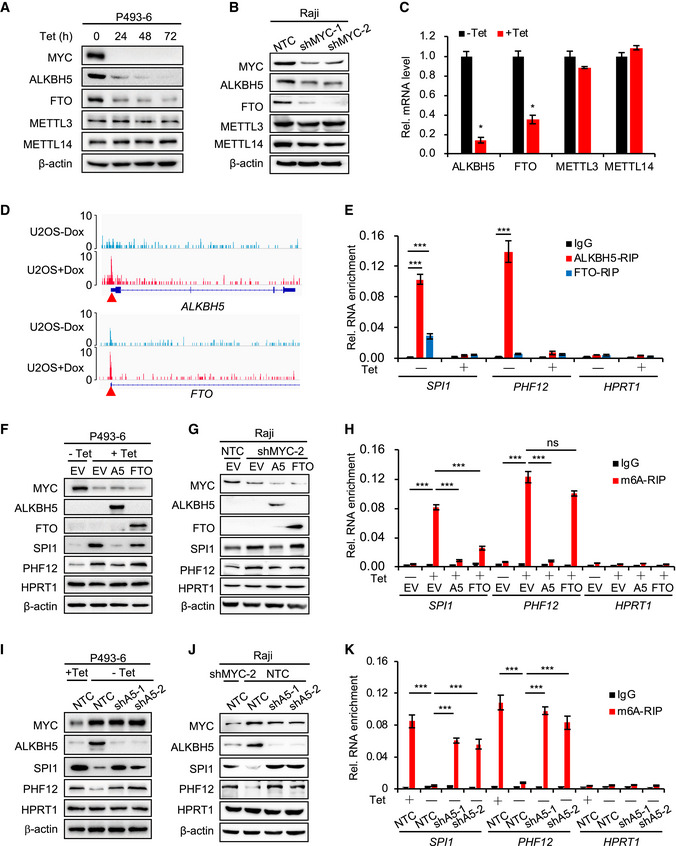
Figure 2. ALKBH5 removes m6A from mRNA and inhibits the protein expression of SPI1/PHF12.
-
A, BWestern blot analysis for protein levels of m6A methyltransferases (METTL3 and METTL14) and demethylases (ALKBH5 and FTO) in P493‐6 cells treated with Tet for 0, 24, 48, and 72 h (A) or in Raji cells that expressed NTC or MYC shRNAs (B). β‐actin serves as loading controls. Data are representative of at least three independent experiments.
-
CRT–qPCR analysis of the mRNA levels of methyltransferases and demethylases in P493‐6 cells treated with Tet for 0 h or 24 h. Data were presented as mean (±SD), n = 3 biological replicates. *P < 0.05 relative to corresponding ‐Tet group (Student's t‐test).
- D
-
ERIP assay, using ALKBH5, FTO, or IgG antibody to detect the binding to MRGs (SPI1 and PHF12) in P493‐6 cells treated with Tet or not. HPRT1 serves as negative control. ***P < 0.001 as compared to corresponding IgG group (mean ± SD, n = 3 biological replicates, Student's t‐test).
-
F, GWestern blot analysis for protein levels in P493‐6 cells that overexpressed empty vector (EV), ALKBH5, or FTO and were then treated with Tet or not (F) or in Raji cells expressed NTC or MYC shRNAs (G). HPRT1 and β‐actin served as negative and loading controls, respectively. Data are representative of at least three independent experiments.
-
Hm6A RIP assay in (F) that P493‐6 cells that overexpressed EV, ALKBH5, or FTO and were then treated with Tet or not. HPRT1 serves as negative control. ***P < 0.001 as compared between indicated groups. ns, not significant (mean ± SD, n = 3 biological replicates, Student's t‐test).
-
I, JWestern blot analysis for protein levels in P493‐6 cells that expressed NTC or ALKBH5 shRNAs and were then treated with Tet or not (I) or in Raji cells expressed NTC or ALKBH5 shRNAs and knocked down MYC or not (J). HPRT1 and β‐actin serve as negative and loading controls, respectively. Data are representative of at least three independent experiments.
-
Km6A RIP assay in (I). HPRT1 serves as negative control. ***P < 0.001 as compared between indicated groups (mean ± SD, n = 3 biological replicates, Student's t‐test).
Source data are available online for this figure.