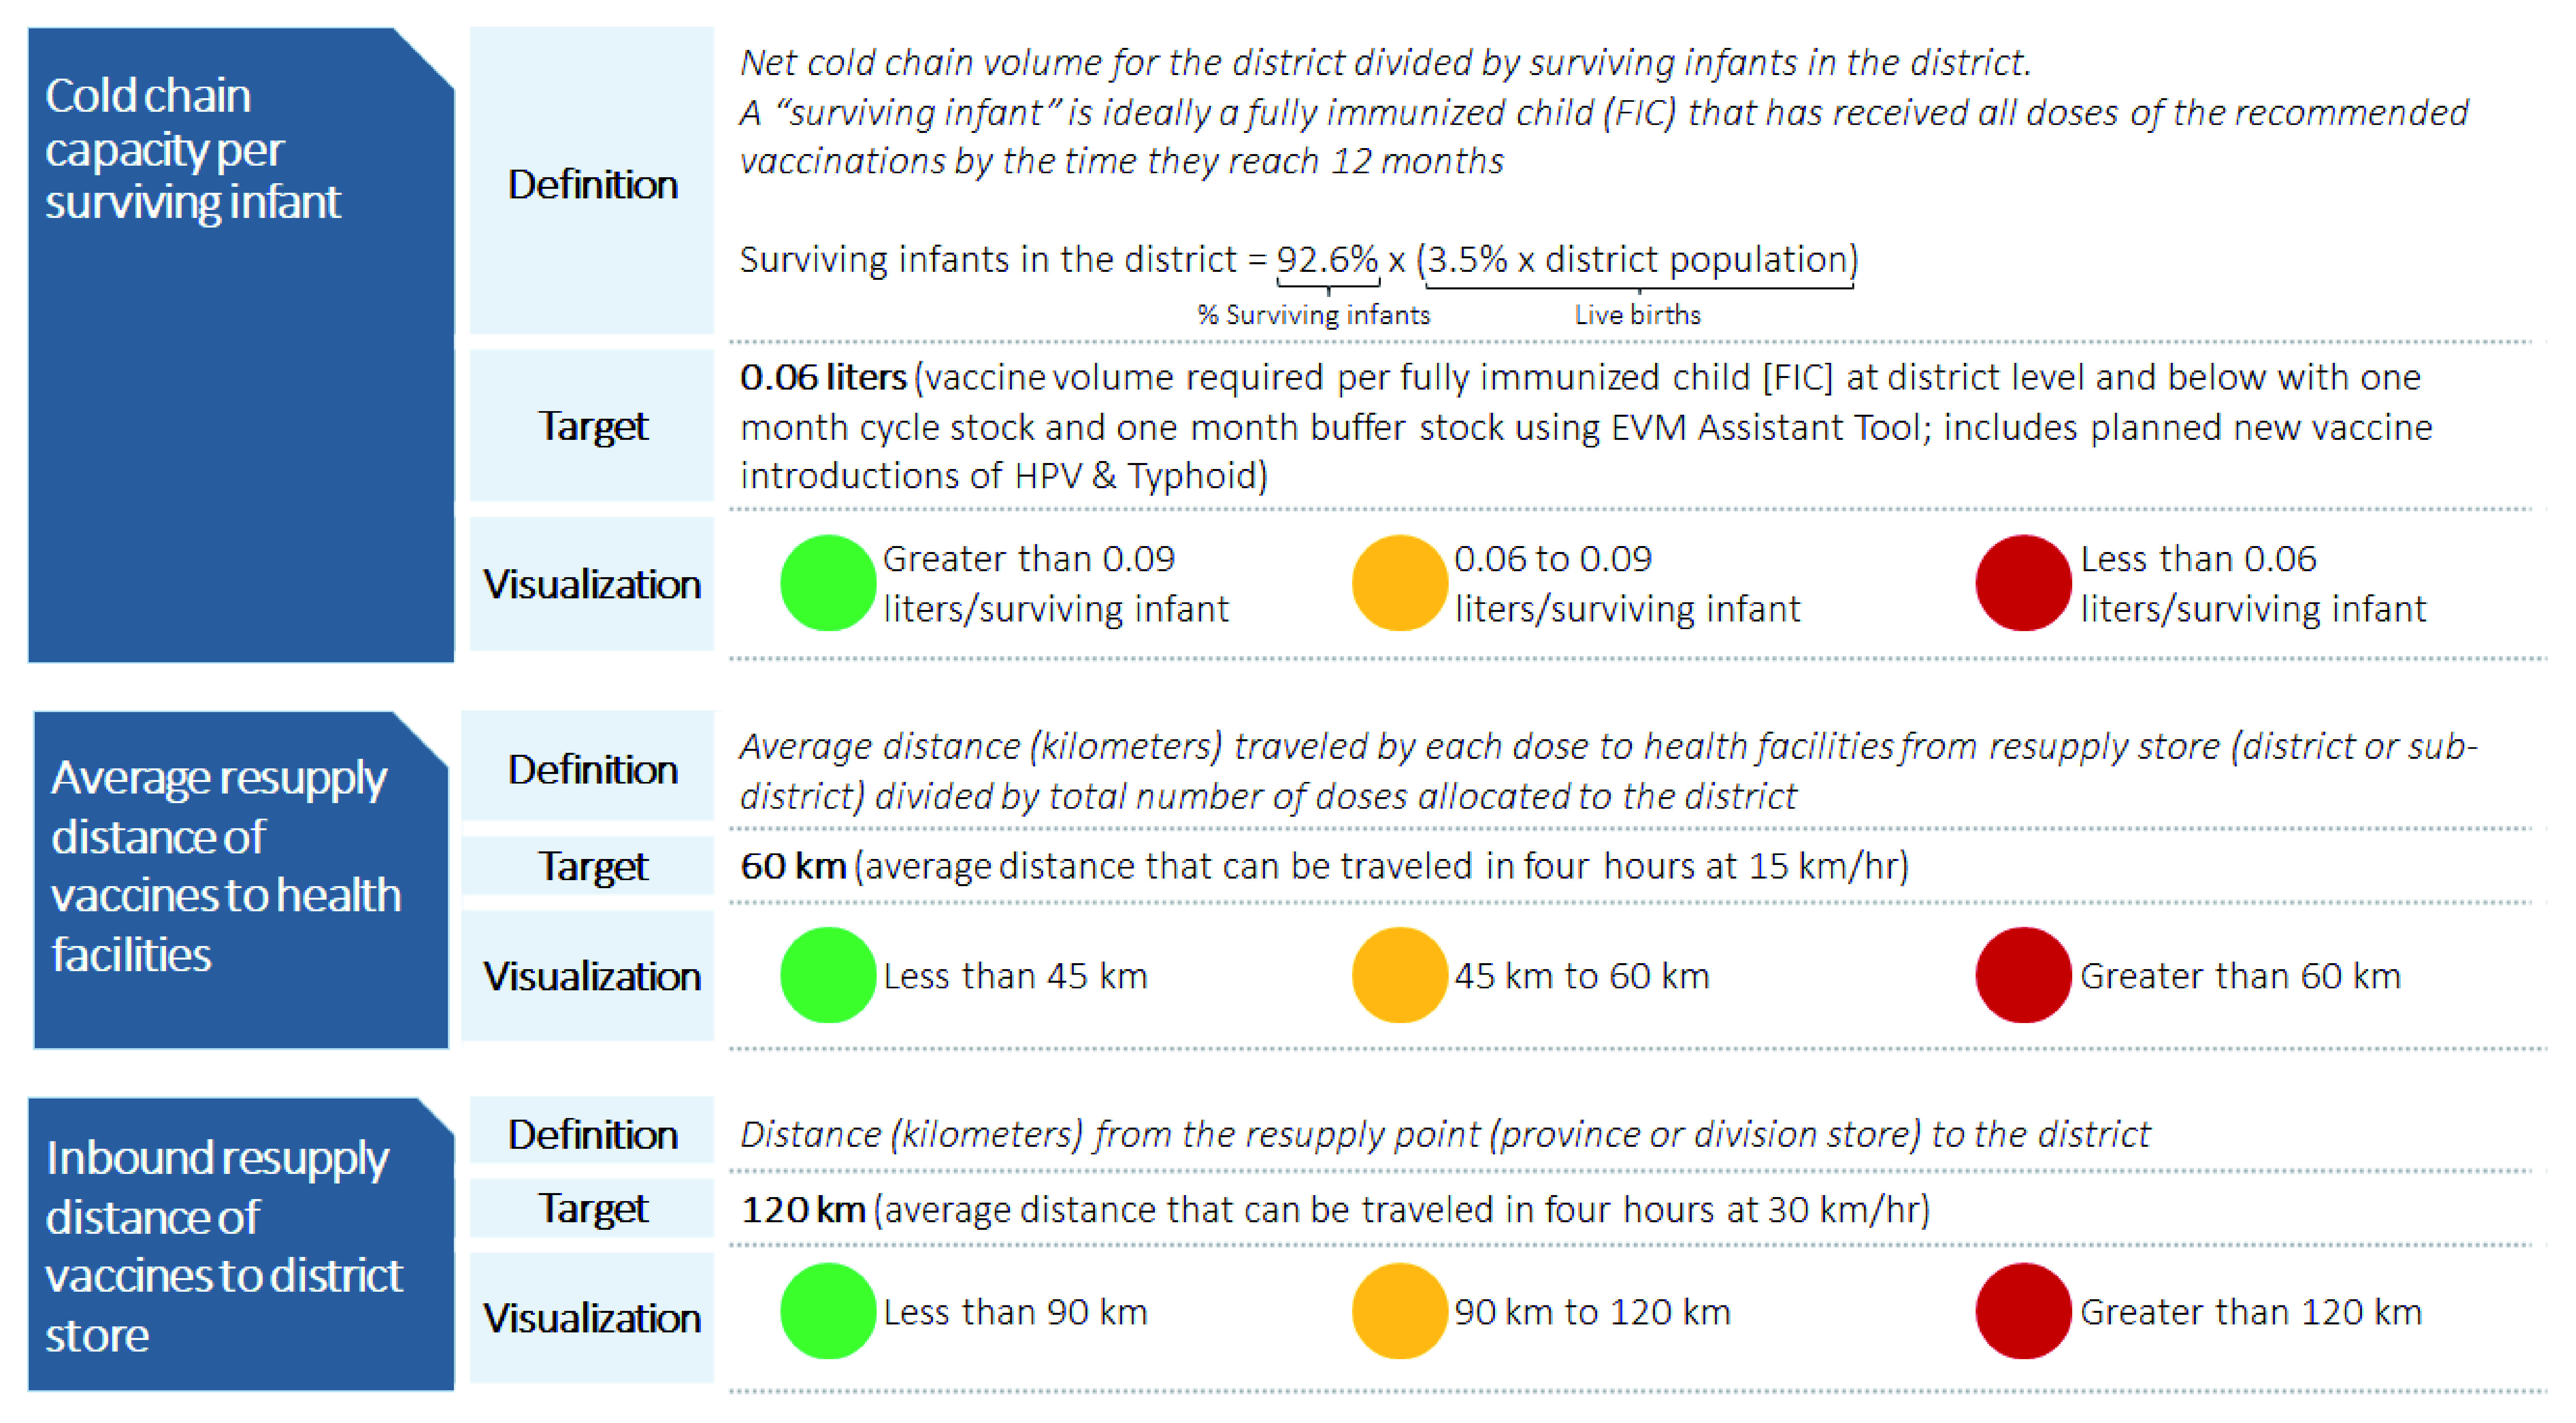
Figure 1. Three supply chain metrics to assess equity in supply chain design.

Red - Indicator is outside range of the target; Yellow - Indicator is at the target range; Green - Indicator is well within the target.

Red - Indicator is outside range of the target; Yellow - Indicator is at the target range; Green - Indicator is well within the target.