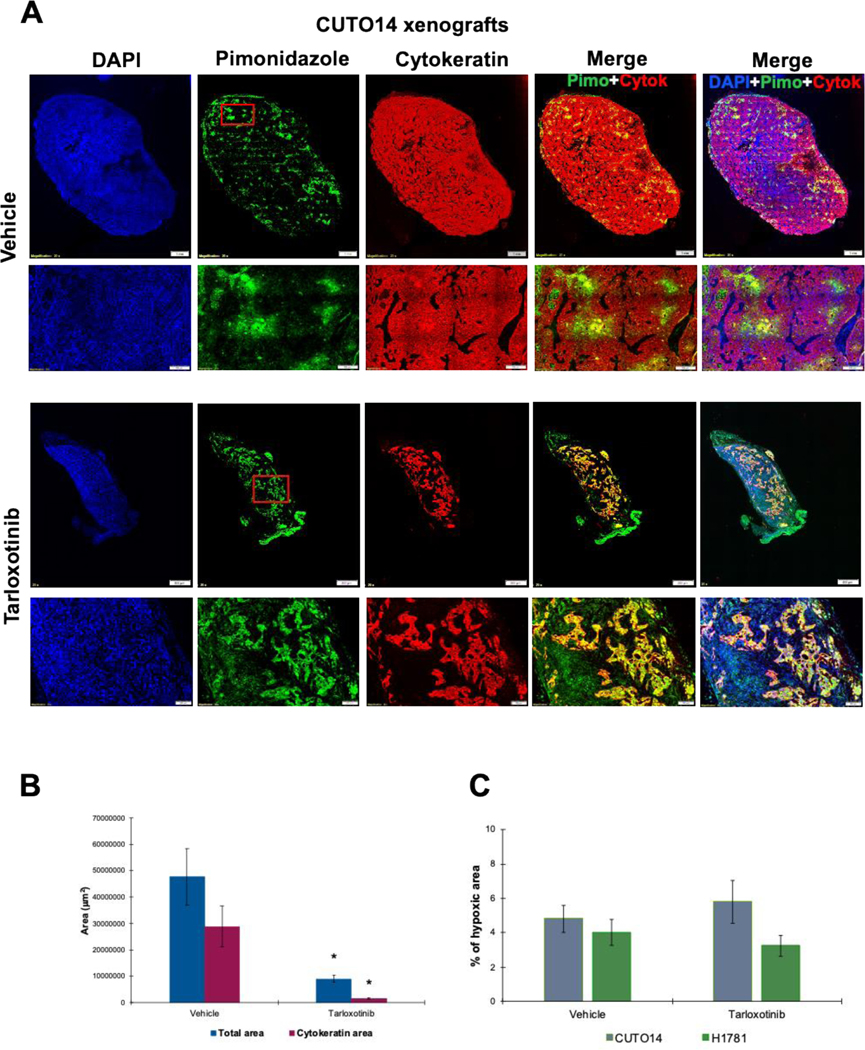
Figure 5. Tumor hypoxia levels in xenograft models.

Mice were dose with pimonidazole HCl (60 mg/kg, IP) one hour before tumor collection. Tissue was fixed, paraffin embedded and process for immunofluorescence. The primary antibody Mab1 binds to protein adducts of pimonidazole in hypoxic cells (green). Cytokeratin staining was used to evaluate tumor content (red). All images were capture at 20× using an Olympus IX83 microscope. Scale bars are 1mm or 500μm as indicated in the figures. A) Images representing vehicle and treated CUTO14 xenografts. Red square in green channel indicates the higher magnification area. B) Total area and cytokeratin positive area in vehicle and treated CUTO14 xenografts. * p< 0.005. C) Percent of total area positive hypoxia staining in CUTO14 and H1781 xenografts. Mean ± SEM is plotted.
