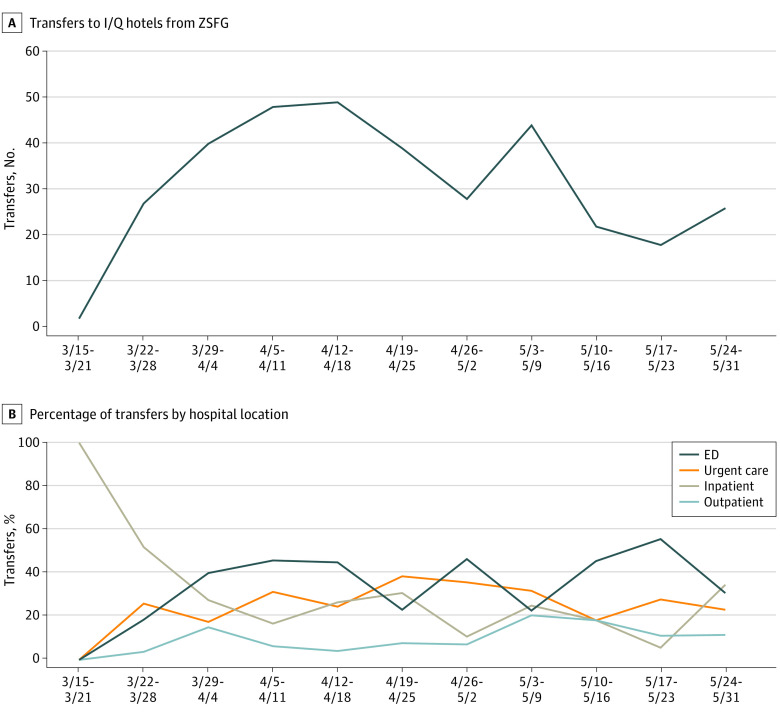
Figure 3. Total Isolation and Quarantine (I/Q) Hotel Transfers From Zuckerberg San Francisco General (ZSFG) Hospital by Hospital Referral Location, March 19 to May 31, 2020 (N = 346).
A, Total number of patient transfers per week to I/Q hotels from ZSFG between March 19 and May 31, 2020. B, Percentage of transfers over time by hospital campus location (ie, emergency department [ED], urgent care, ambulatory care clinic, and inpatient unit). Overall, the proportion of referrals from inpatient units decreased over time, while referrals from other locations increased.

