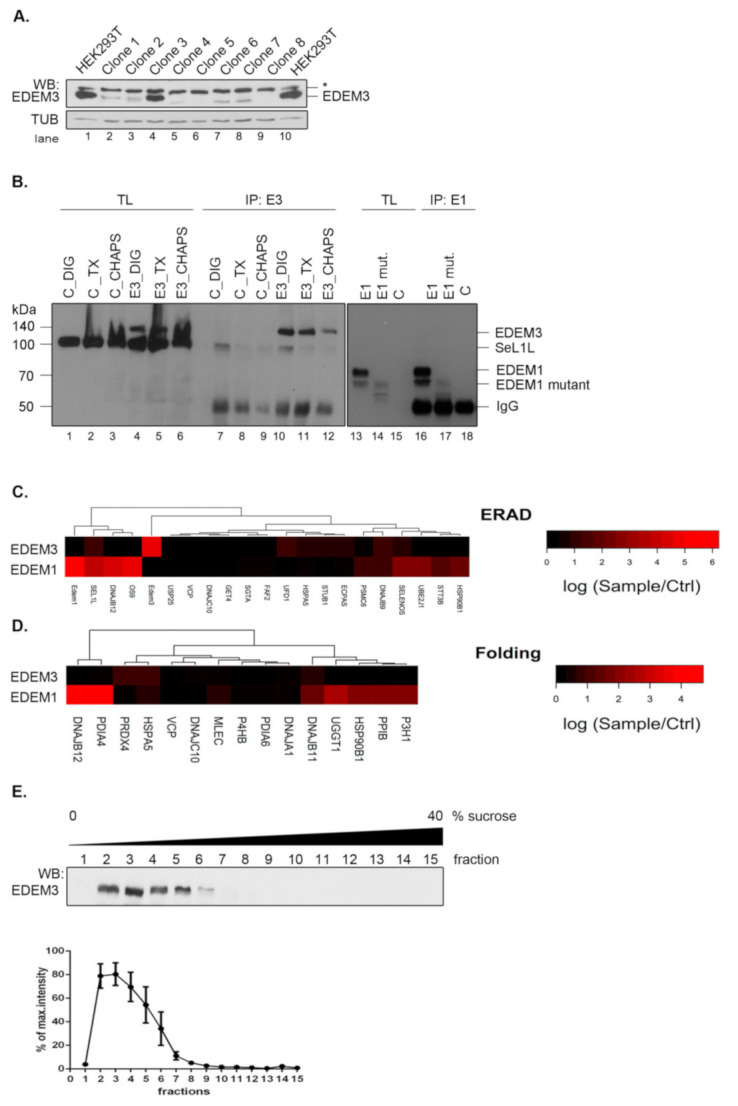
Figure 1.

EDEM3 displays a low interaction profile. (A) EDEM3-KO cell line clone selection. Western blot analysis for EDEM3 expression in different clones after CRISPR/Cas9 procedure. Tubulin (TUB) was employed as loading control. * denotes unspecific cross-reactivity. (B) Pull-down efficiency for EDEM3 and EDEM1 checked by immunoprecipitation and Western blot. The specificity of the EDEM3 antibody was checked in three different lysis buffers, DIG-digitonin, TX-Triton X-100 and CHAPS. EDEM1 and EDEM1-mutant pull-down are also shown for comparison. (C) Heat map denoting the spectral counts log ratios of sample/ctrl for the proteins annotated with the ‘ERAD’ key-term in the Gene Ontology Biological Process (GO BP) UniProtKB database. (D) Similar with (C), but for proteins annotated with the ‘Folding’ key-term and which are ER localized according to GO cellular component (GO CC). For both, only proteins with positive ratios are shown. (E) EDEM3 protein distribution on a continuous 0–40% sucrose gradient. Band densitometry of six independent experiments was represented as the mean% from maximum intensity ± SEM.
